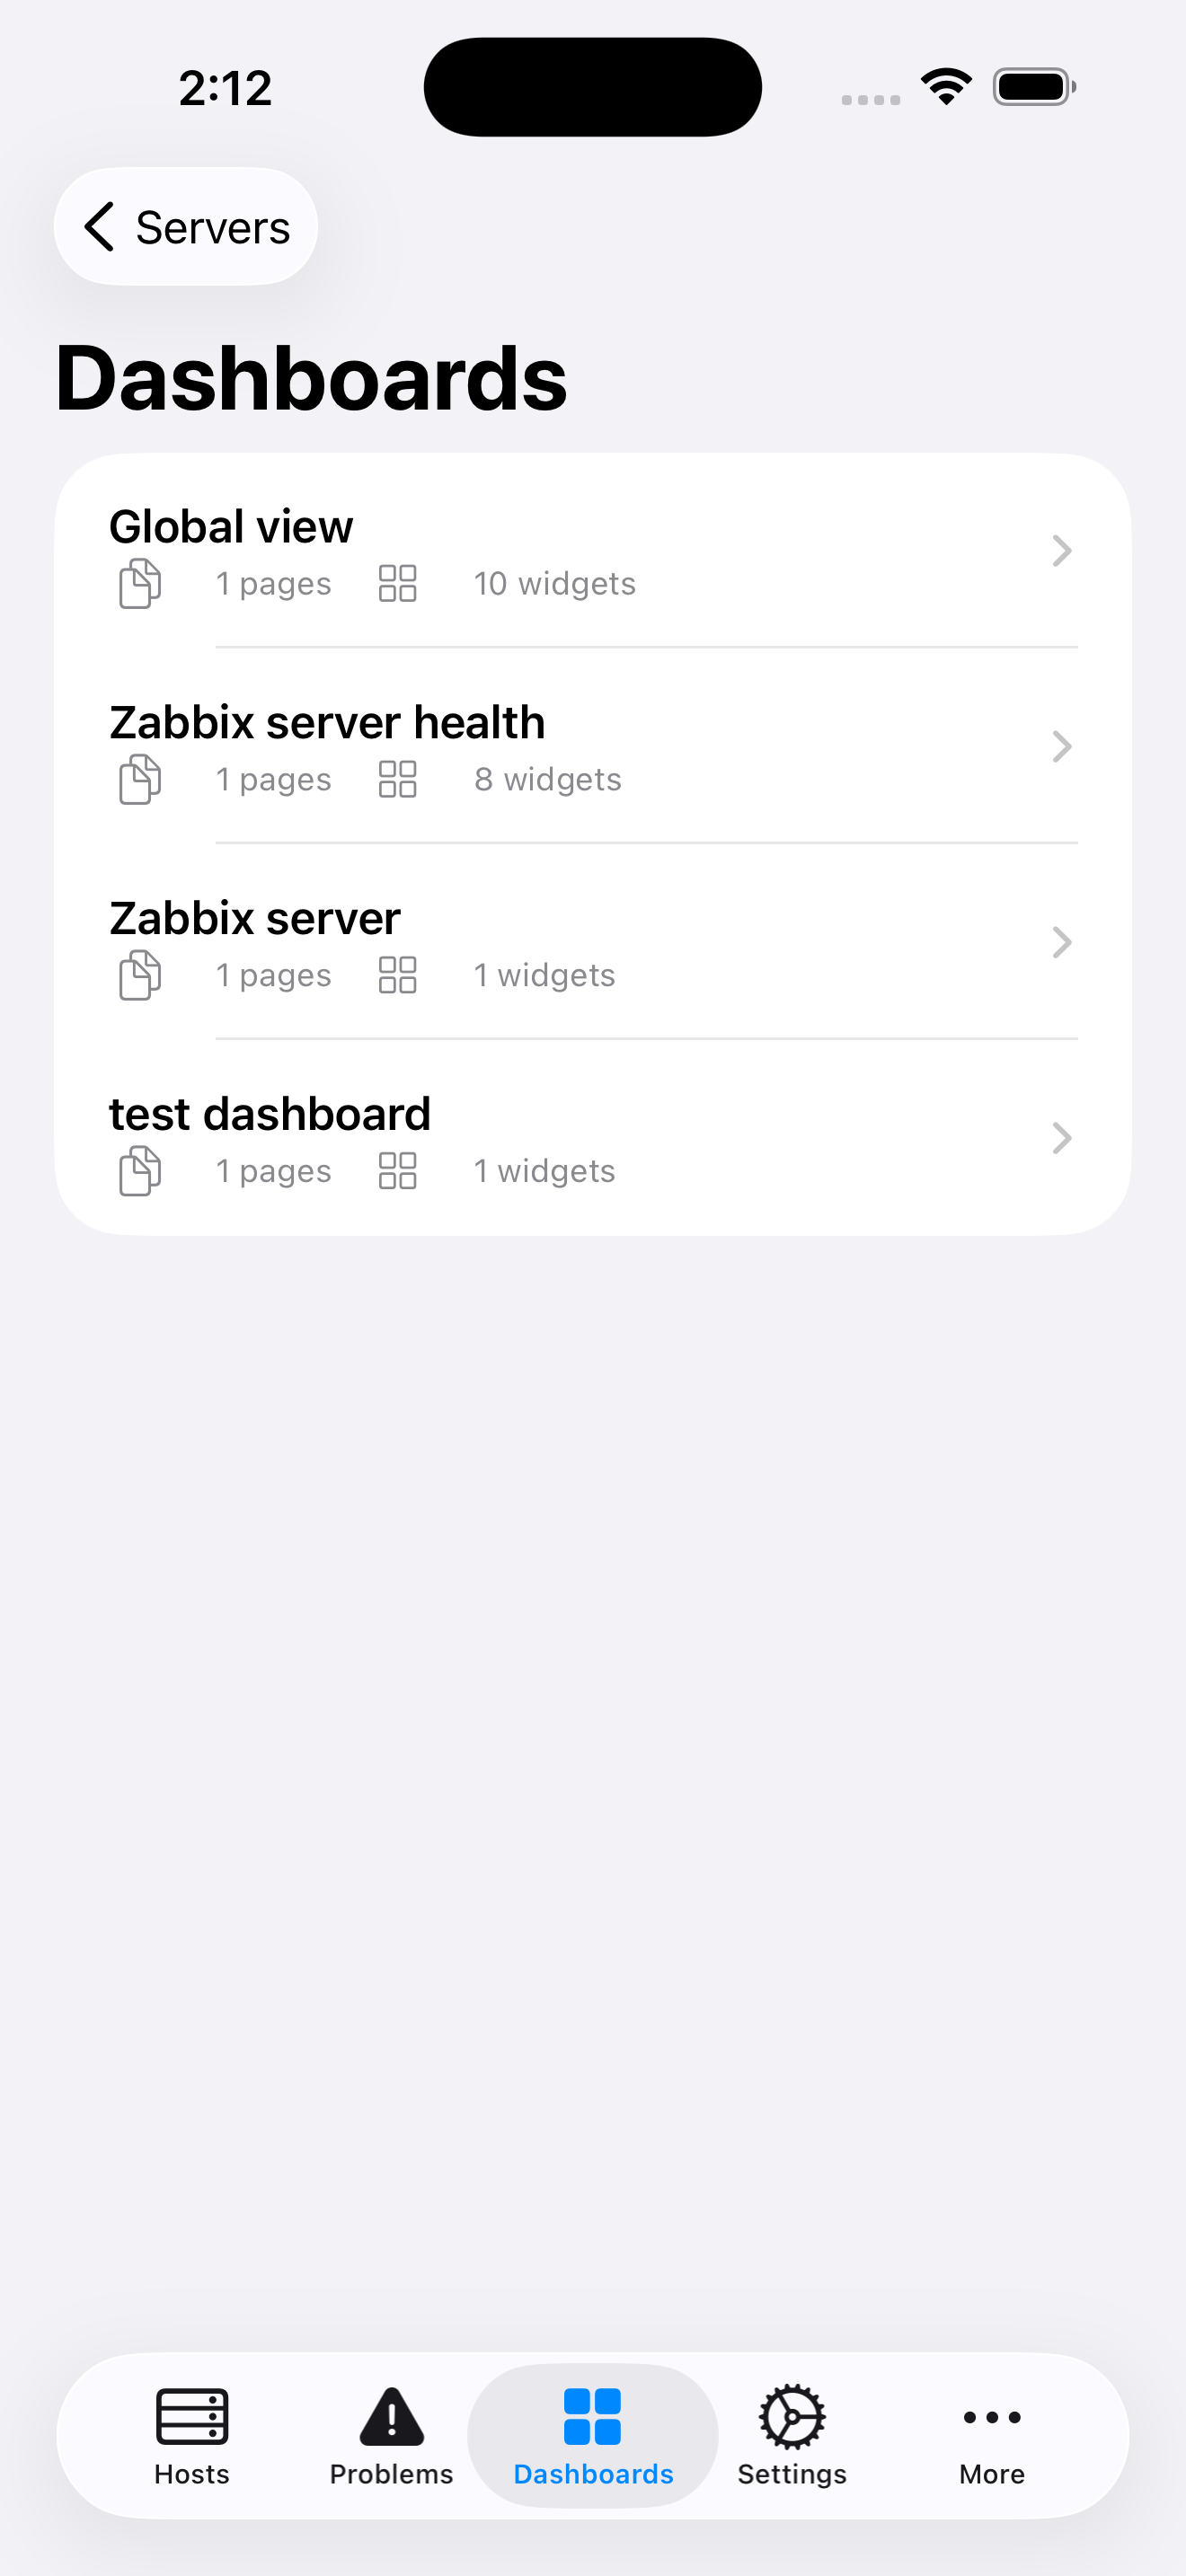
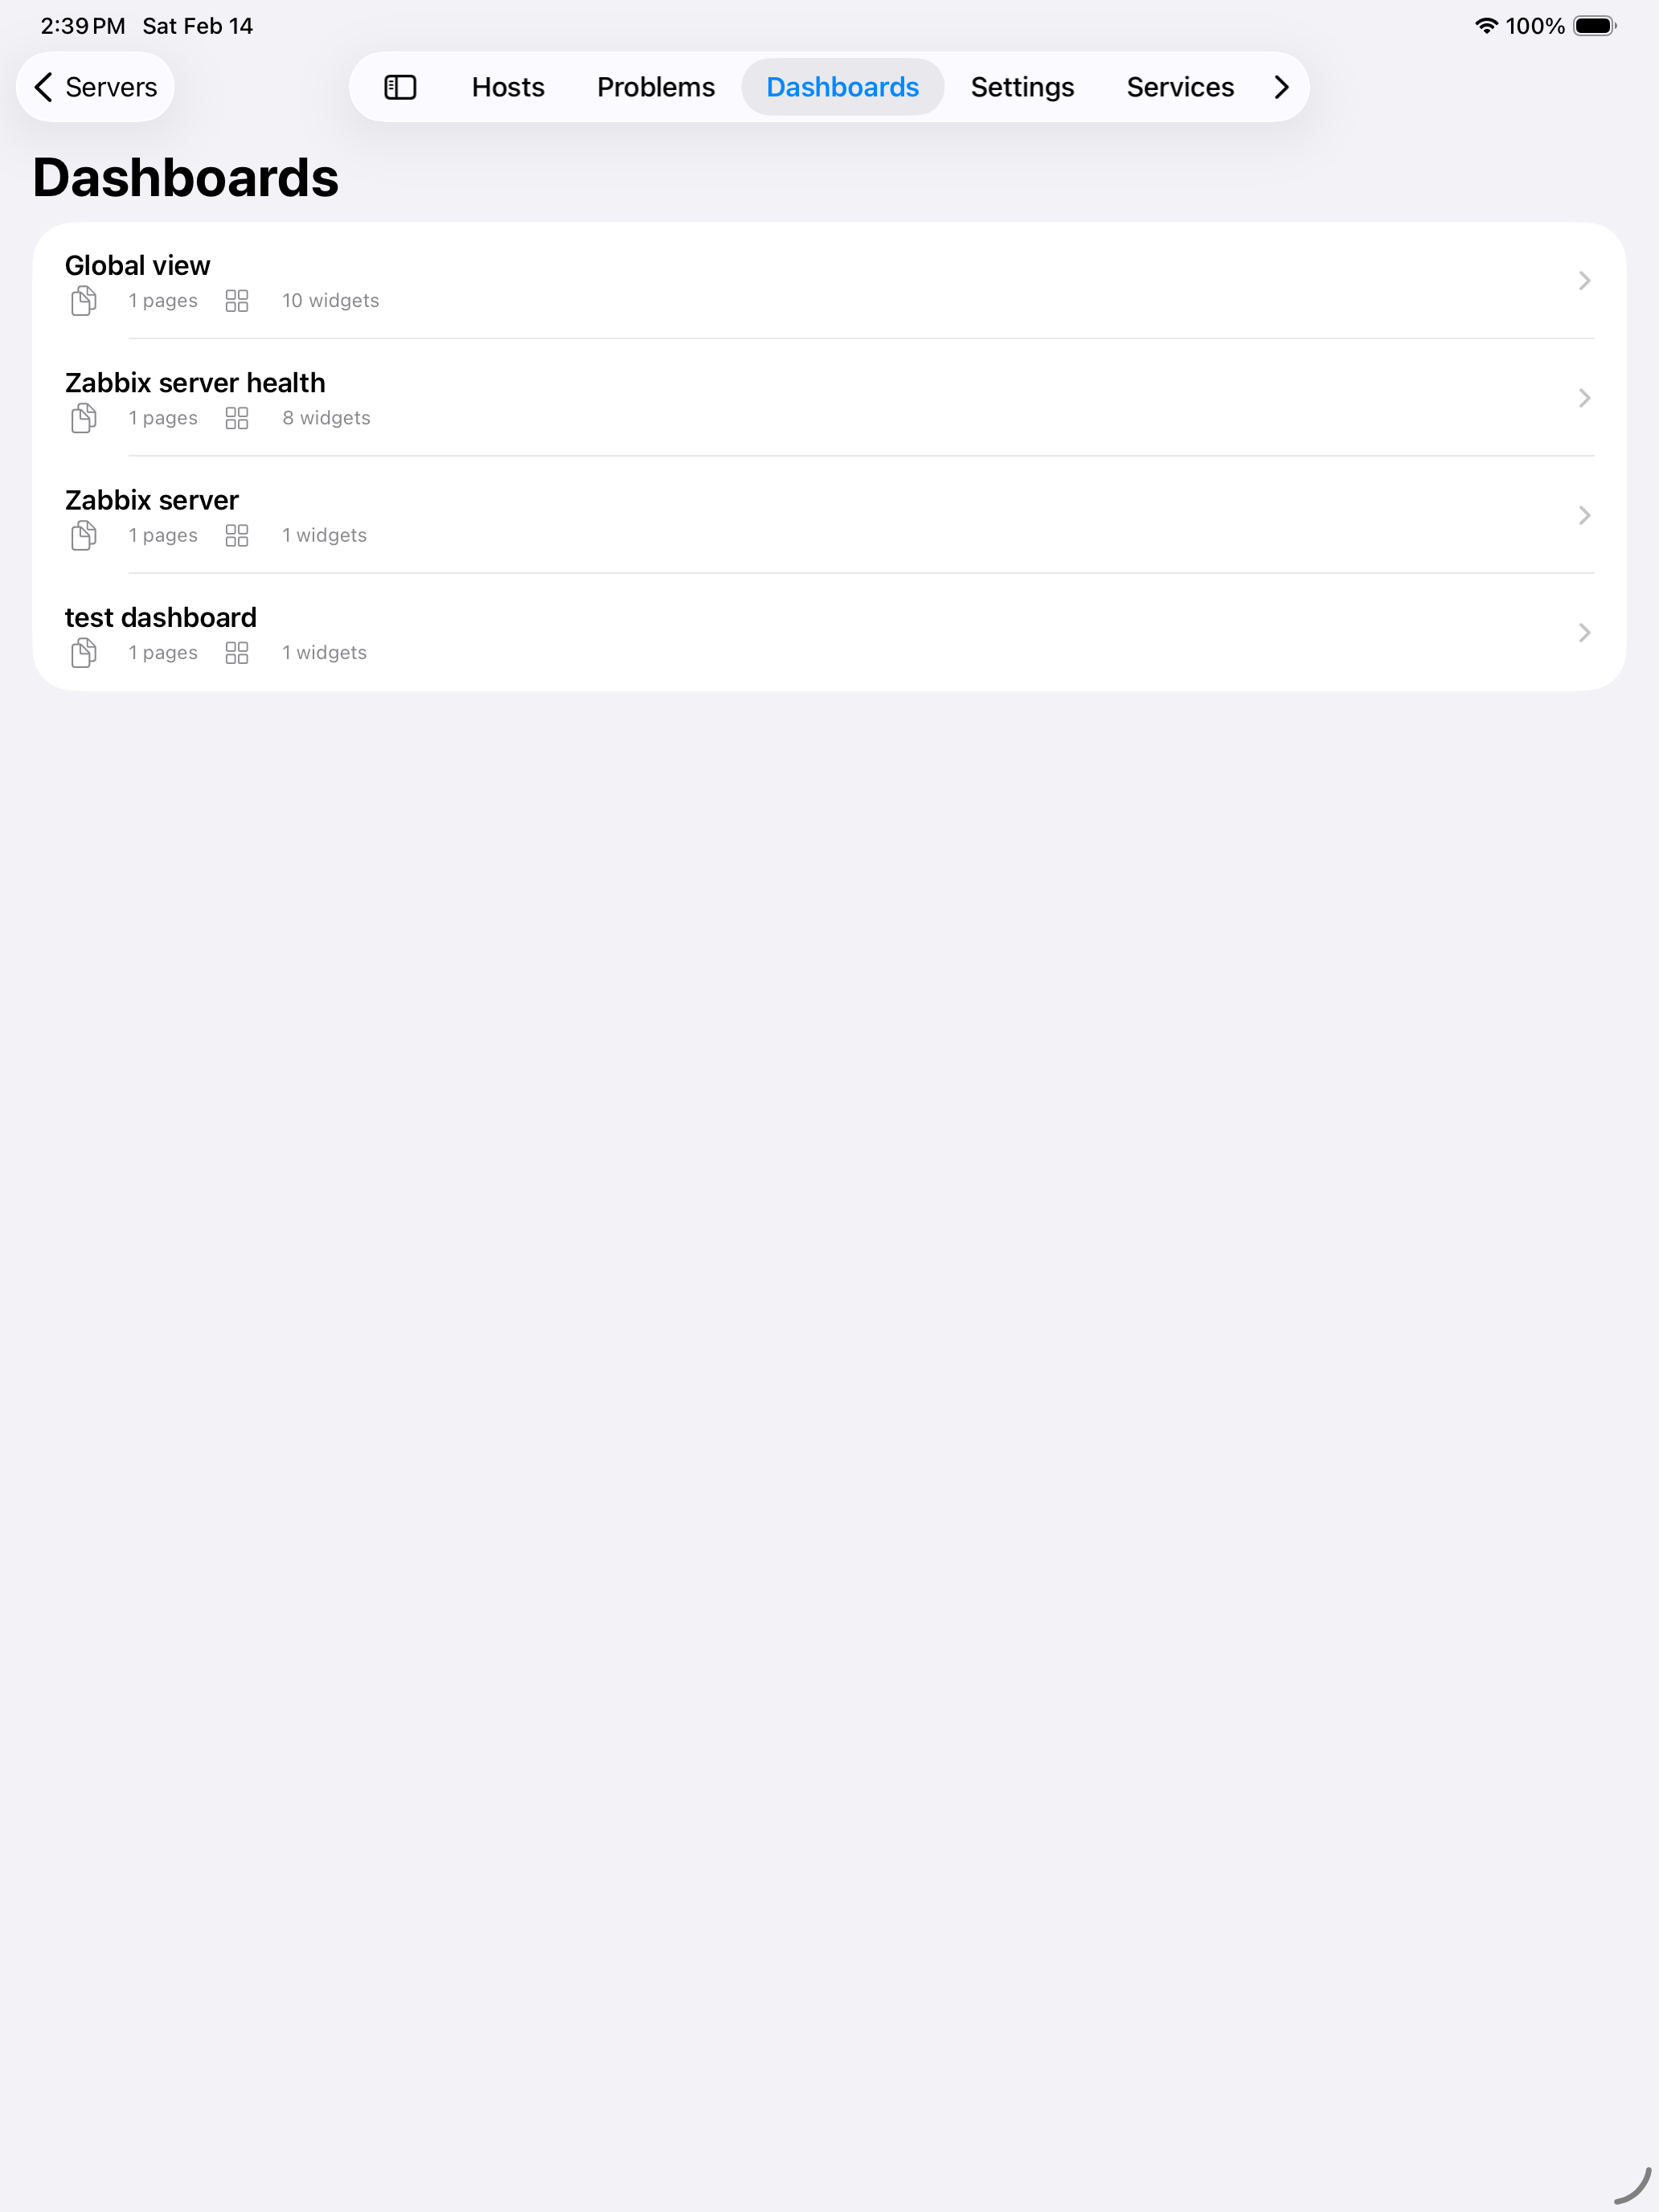
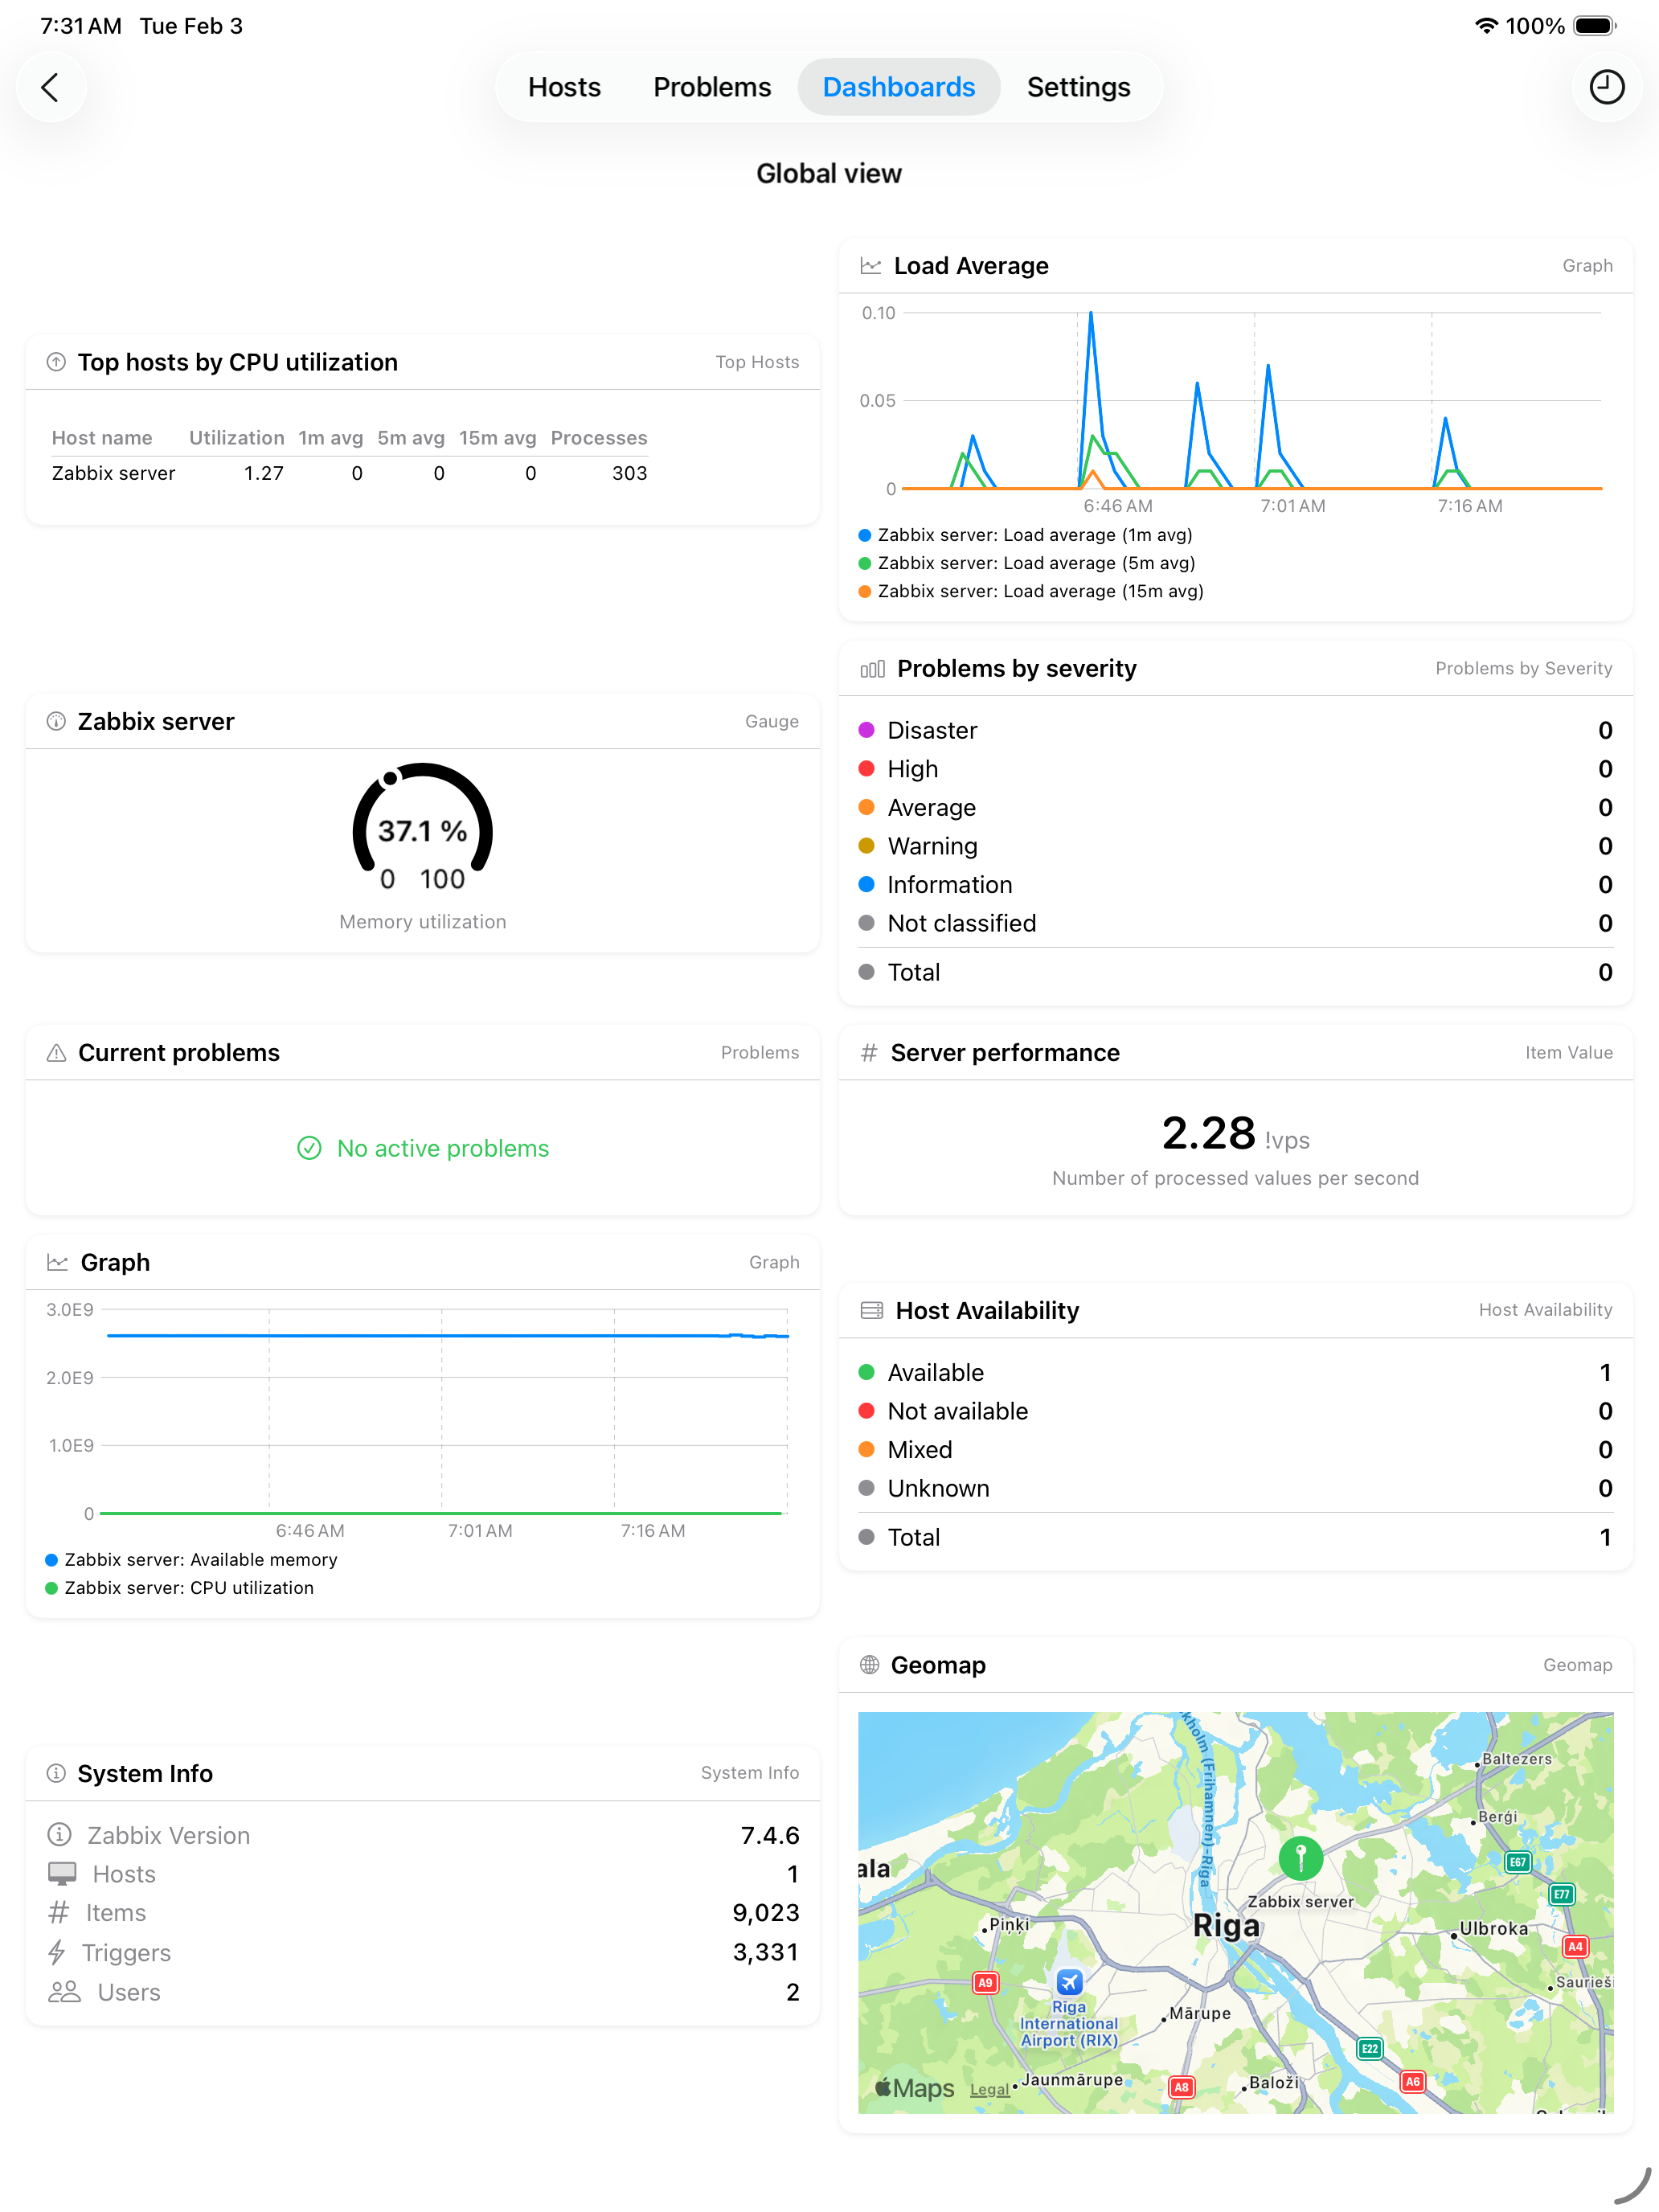
Native Dashboards New in 1.3
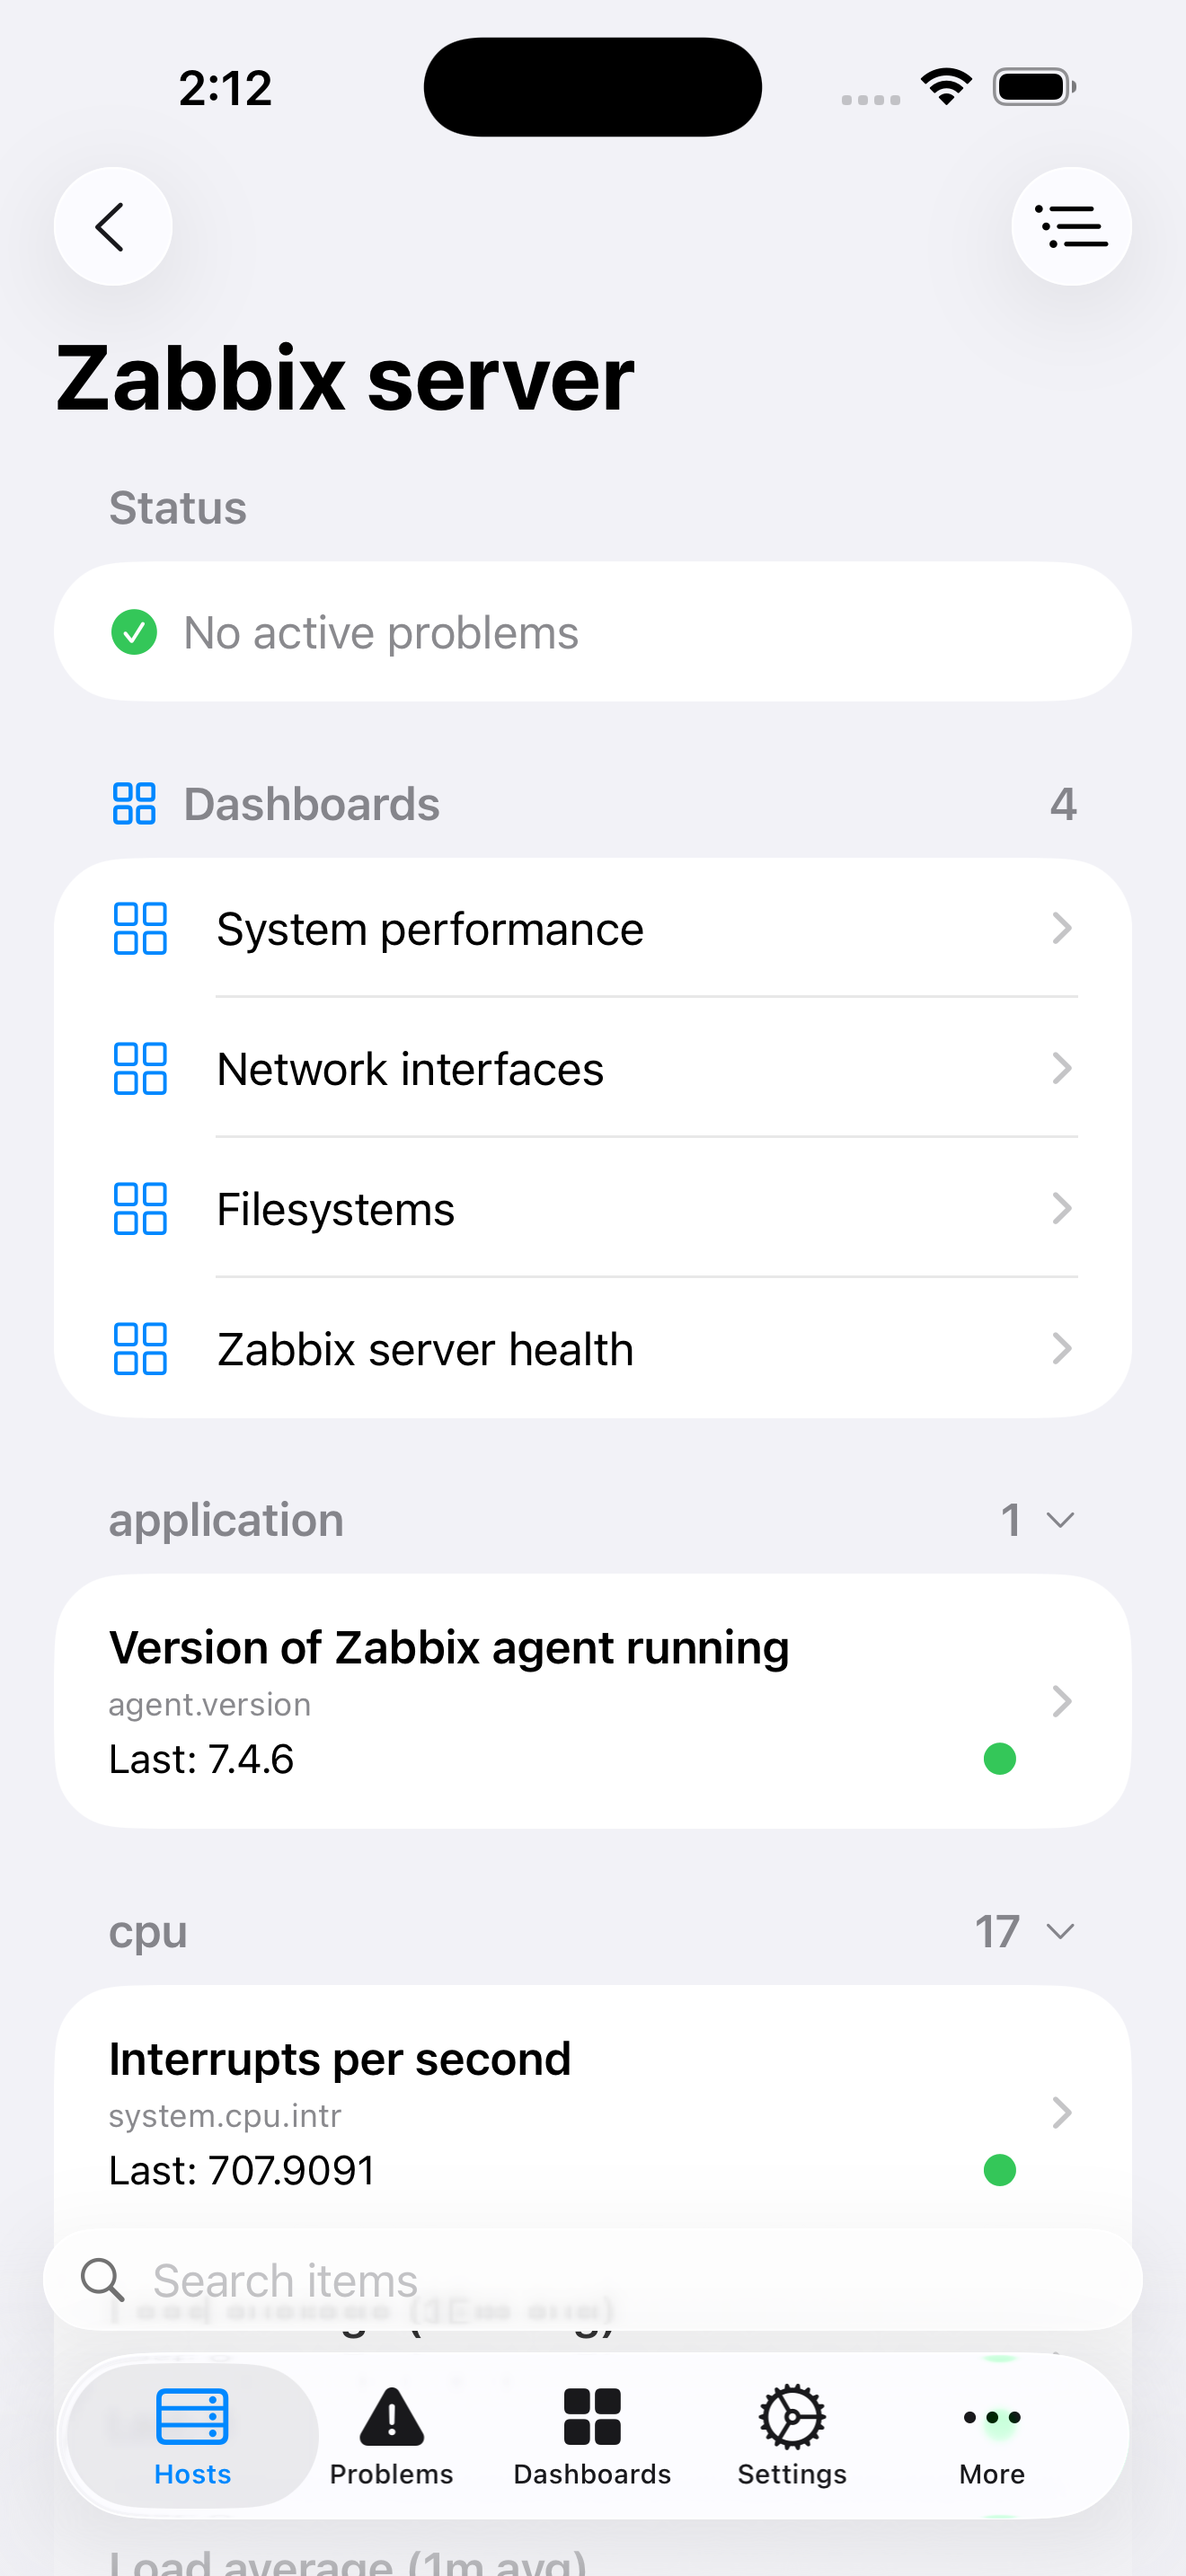
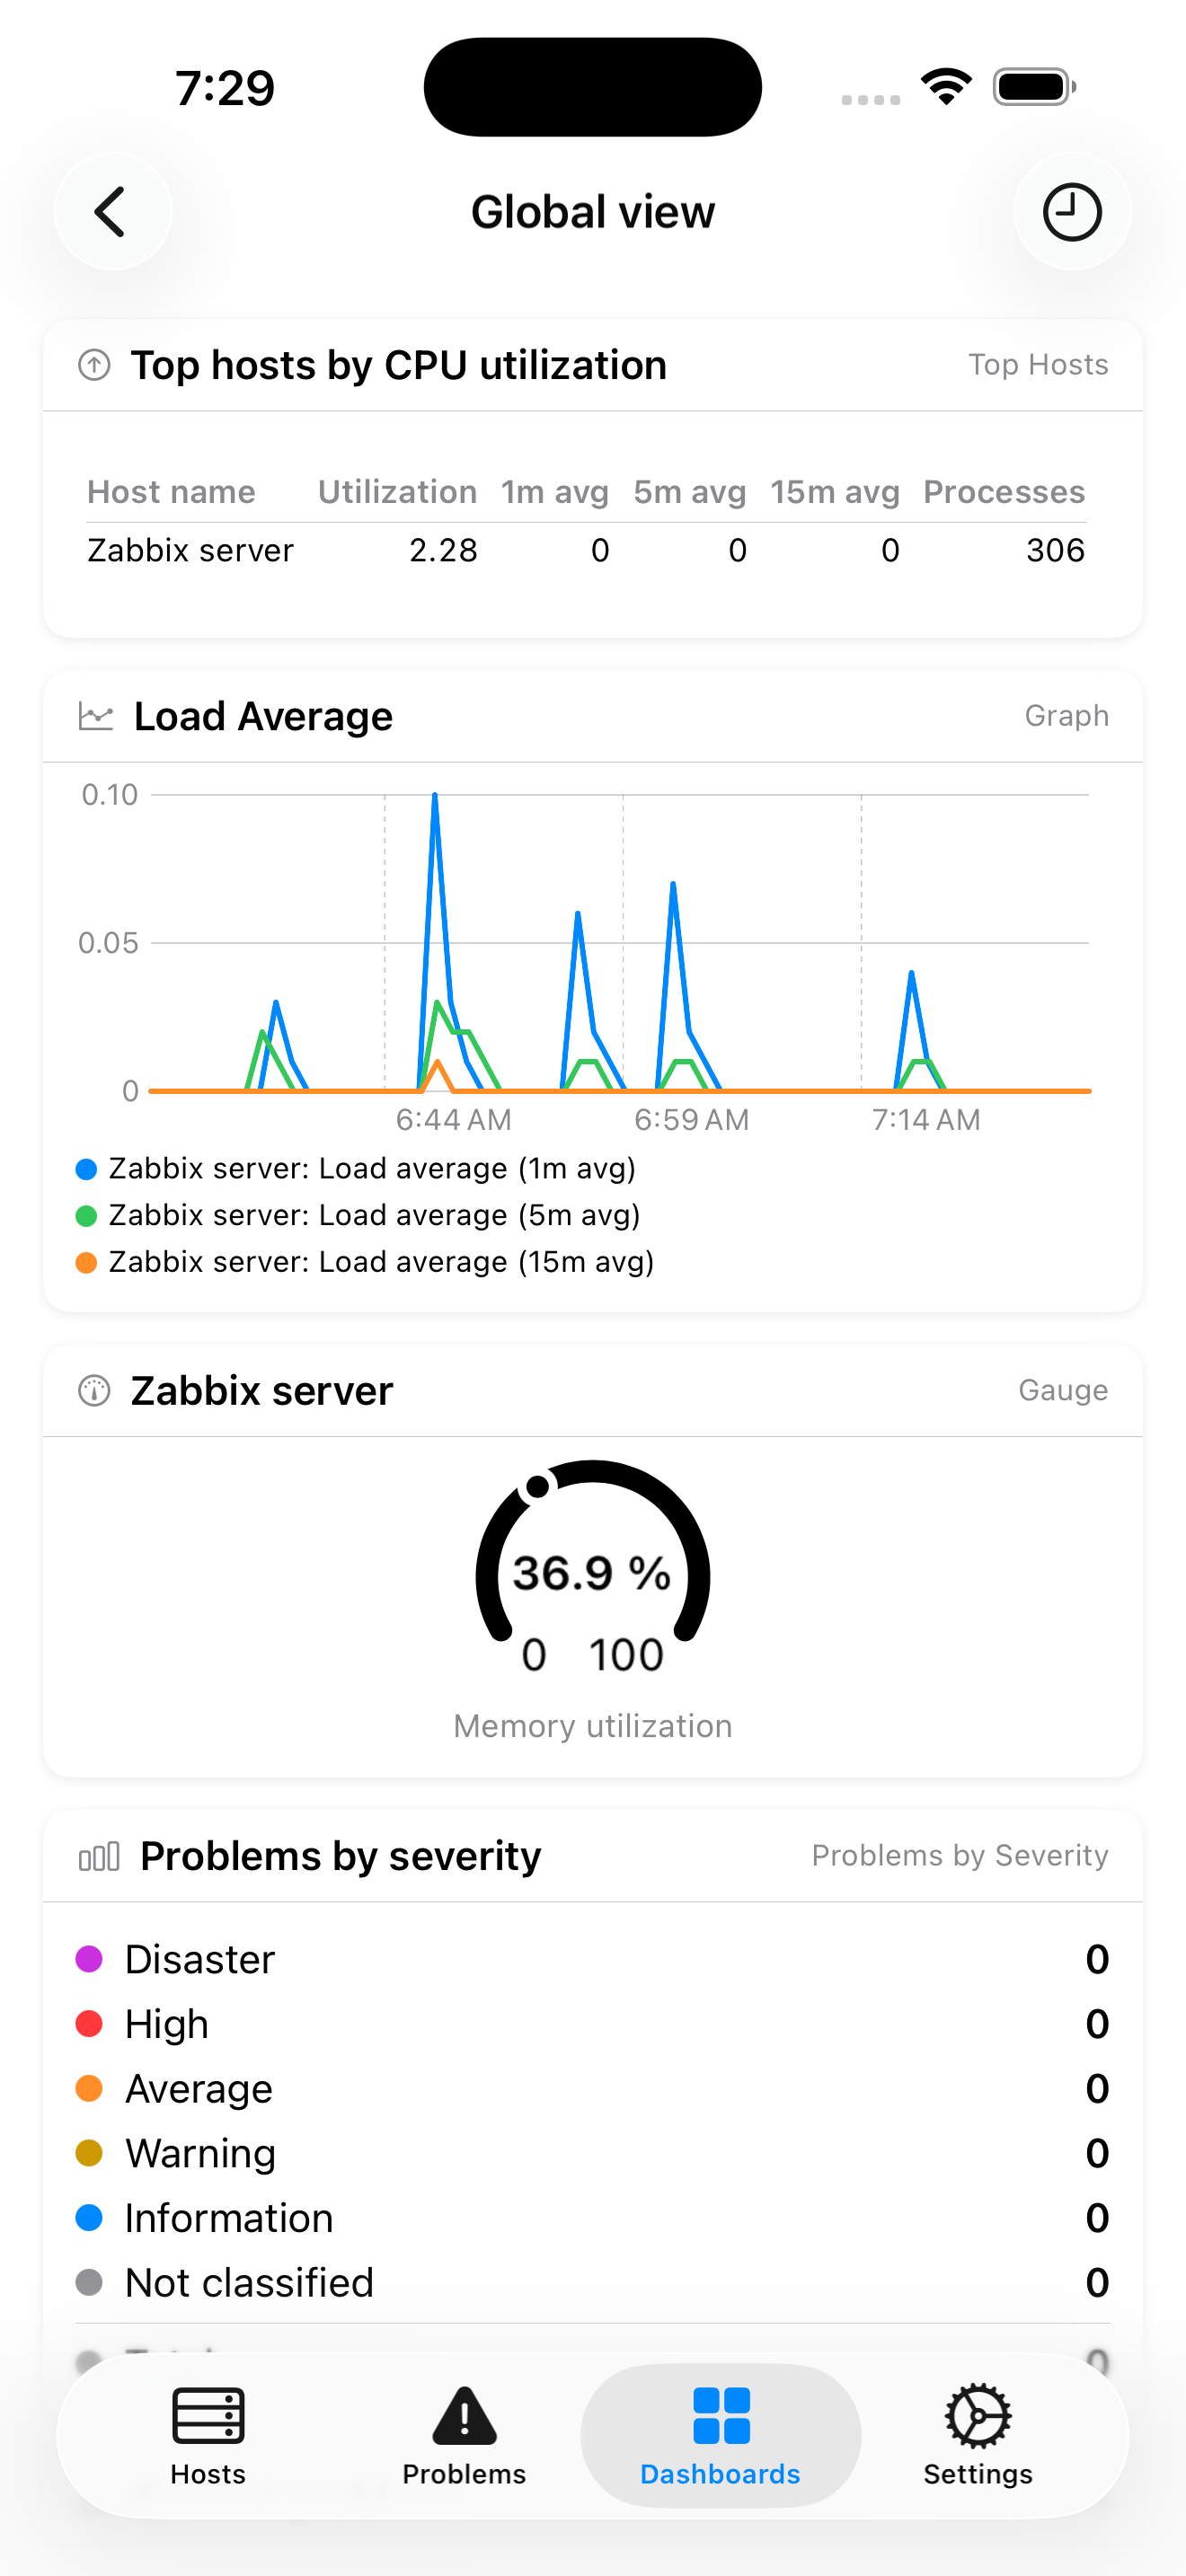
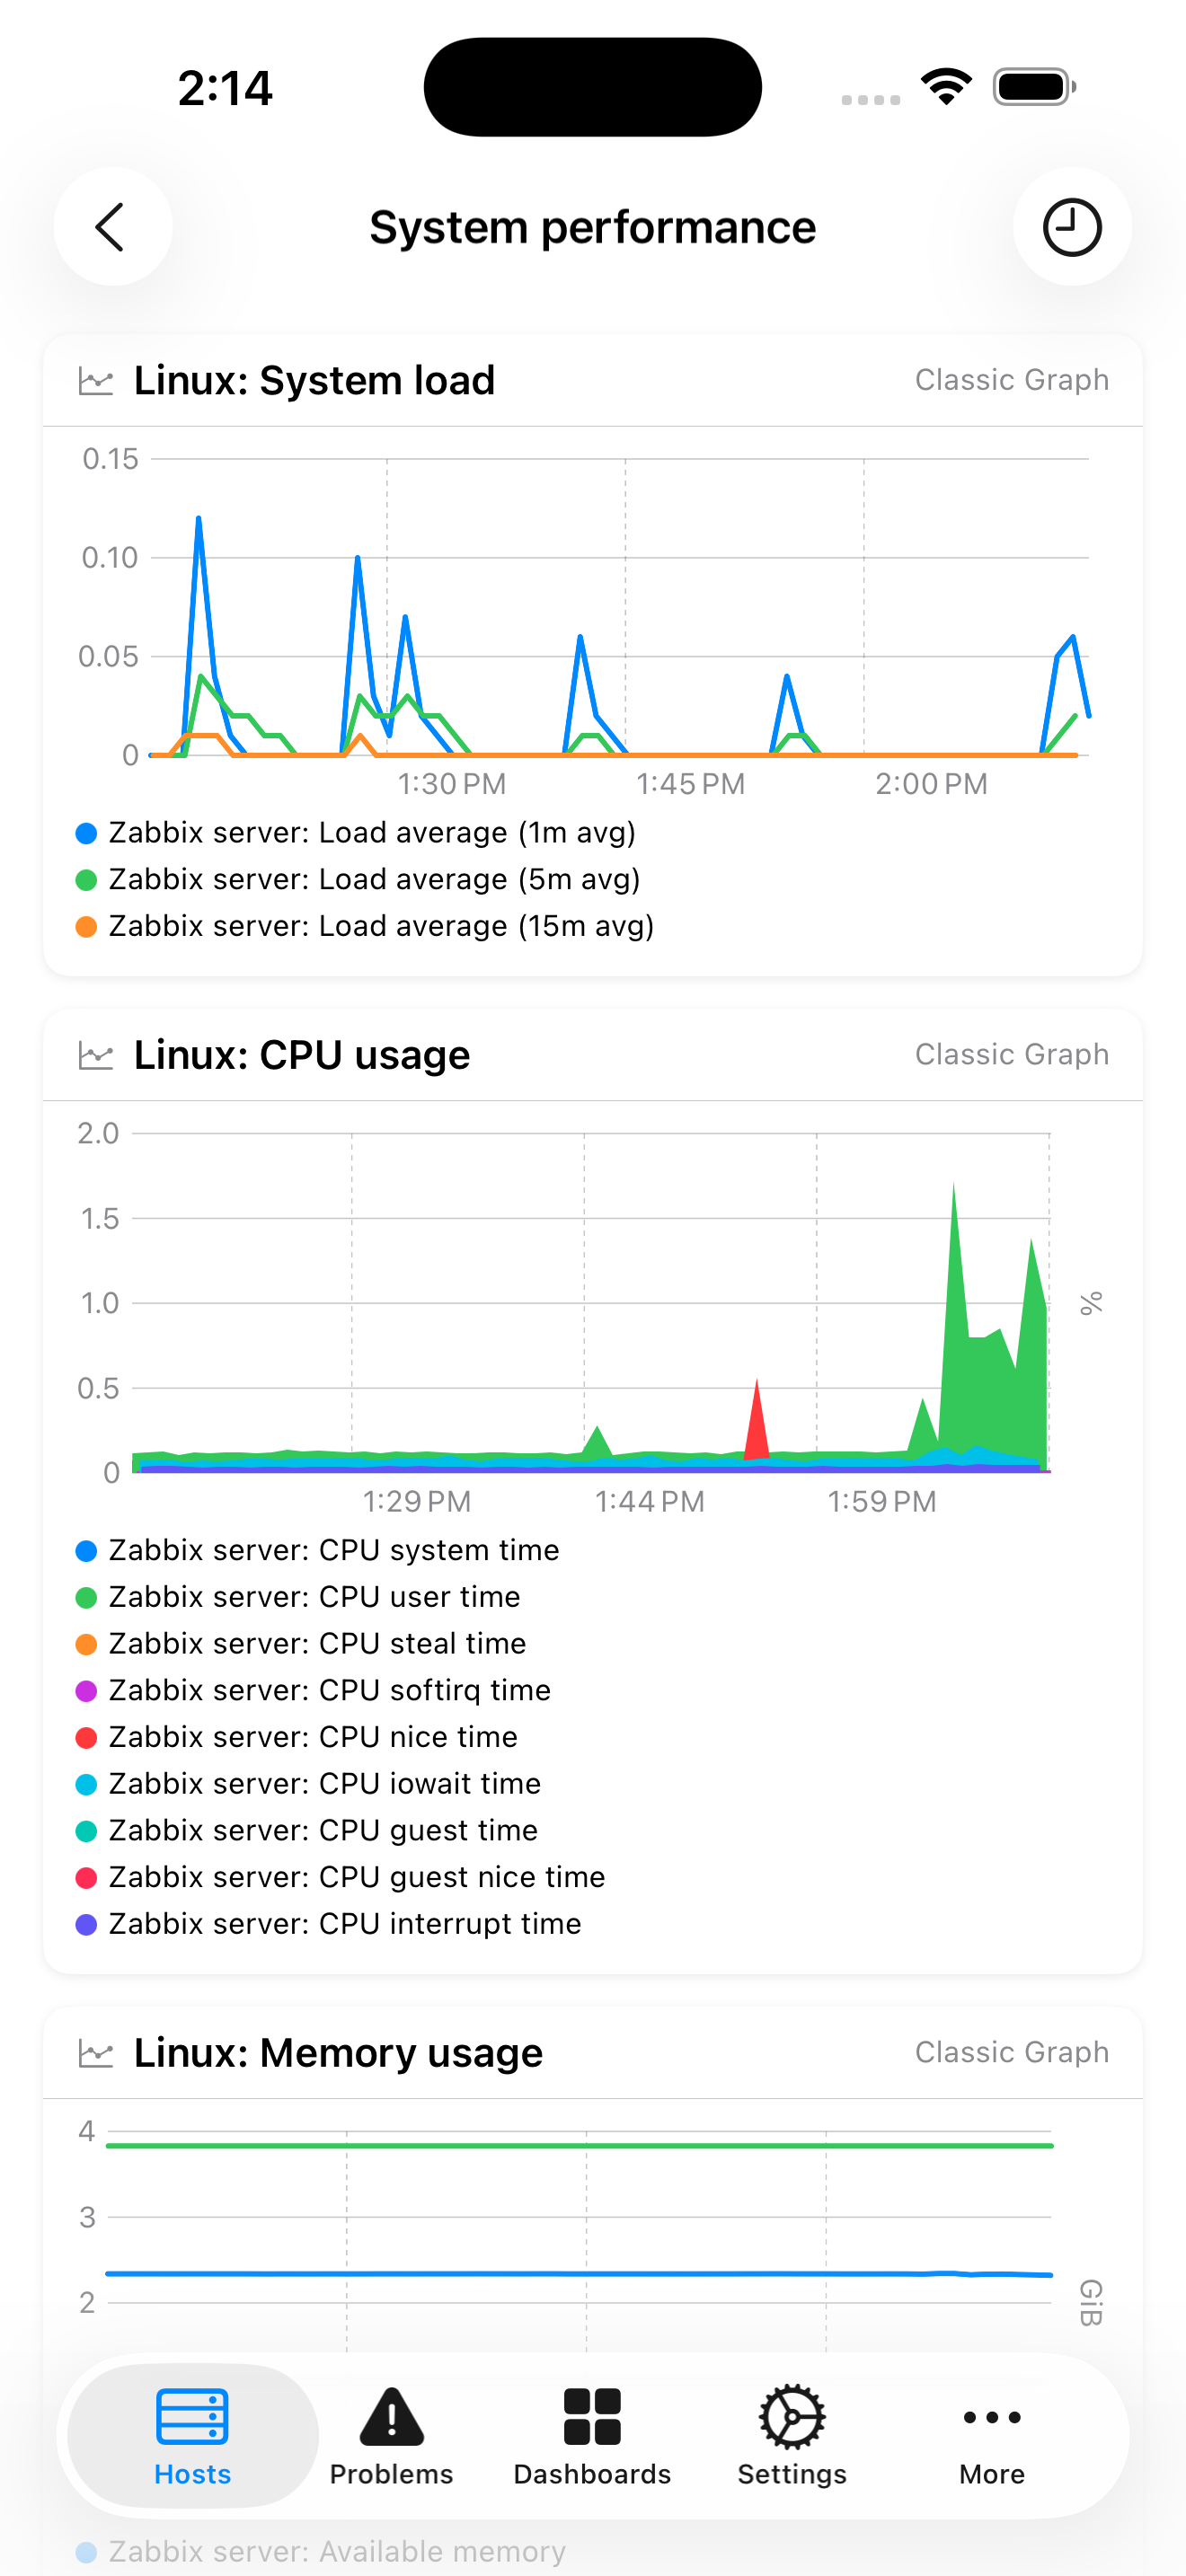
Grafo supports nearly every widget type in your Zabbix dashboards. Browse dashboards, navigate between pages, and view widgets including SVG graphs with scrollable legends, gauges, item values, problems, host availability, top hosts, geographic and network maps, SLA reports, action logs, data overviews, web monitoring, plain text, clocks, pie charts, and more. Dashboard time controls let you select a range that applies across all graph widgets, and per-widget time configurations from Zabbix are respected. Access host dashboards directly from any host to see system performance, network, and storage graphs in context.
Multi-Server Monitoring
Configure and switch between multiple Zabbix servers from a single app. Whether you manage one environment or a dozen, Grafo keeps them all within reach. Connect via API token.
Problems at a Glance
See every active problem across your infrastructure, color-coded by severity from Information to Disaster. Filter by severity or acknowledgment status, search by name or host, and take action with a swipe—acknowledge, close, or suppress directly from your phone.
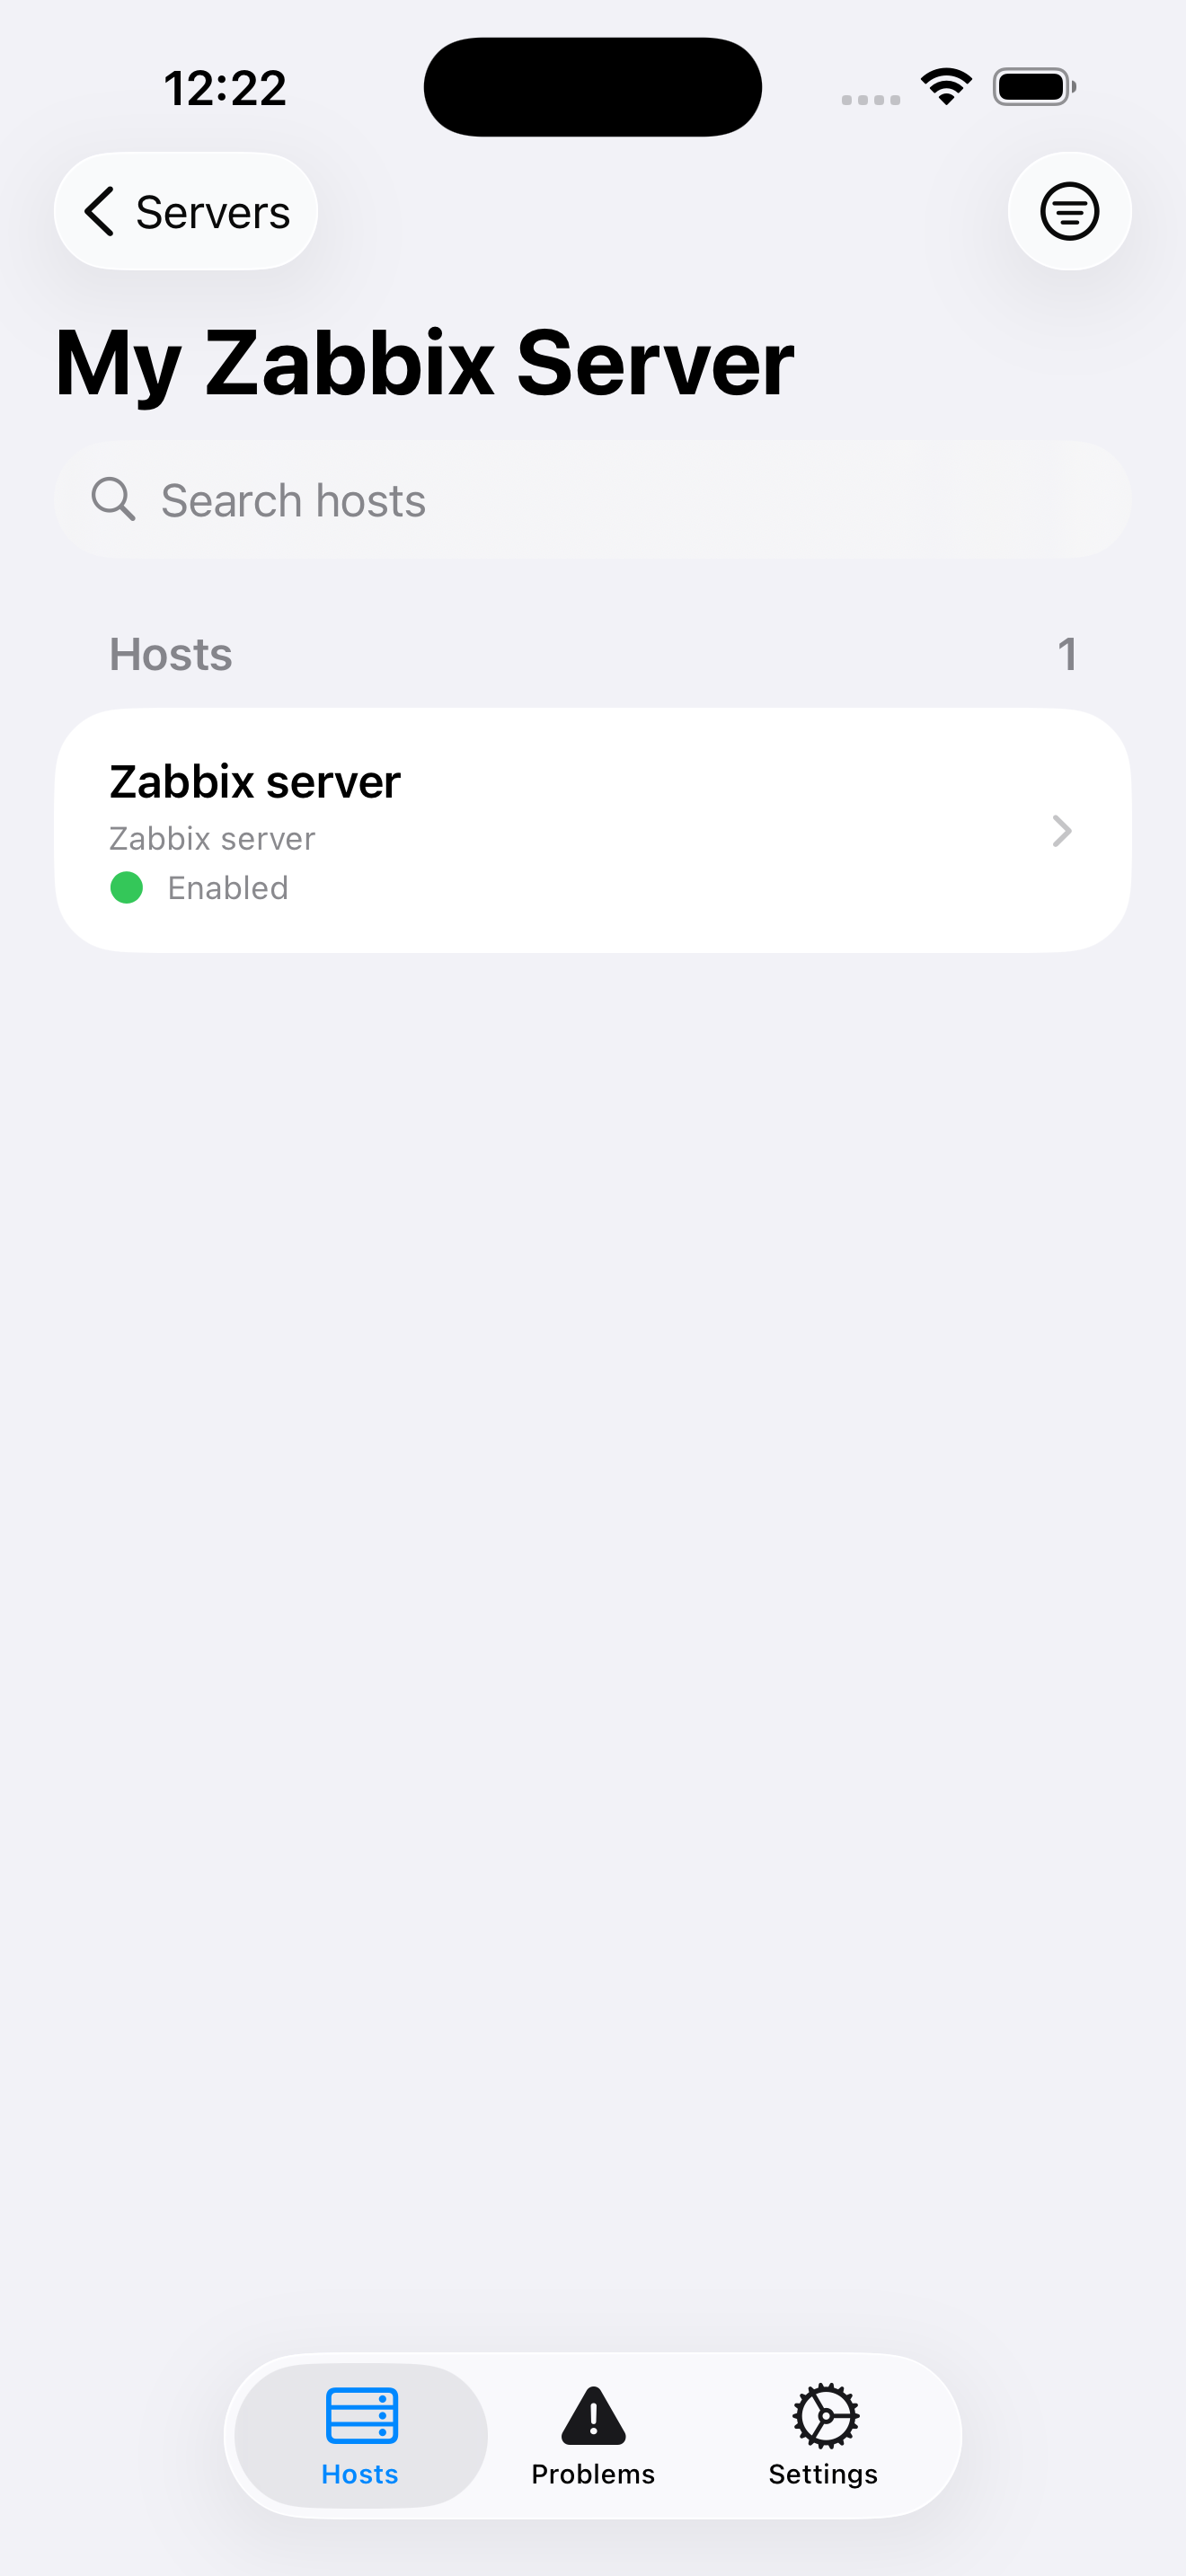
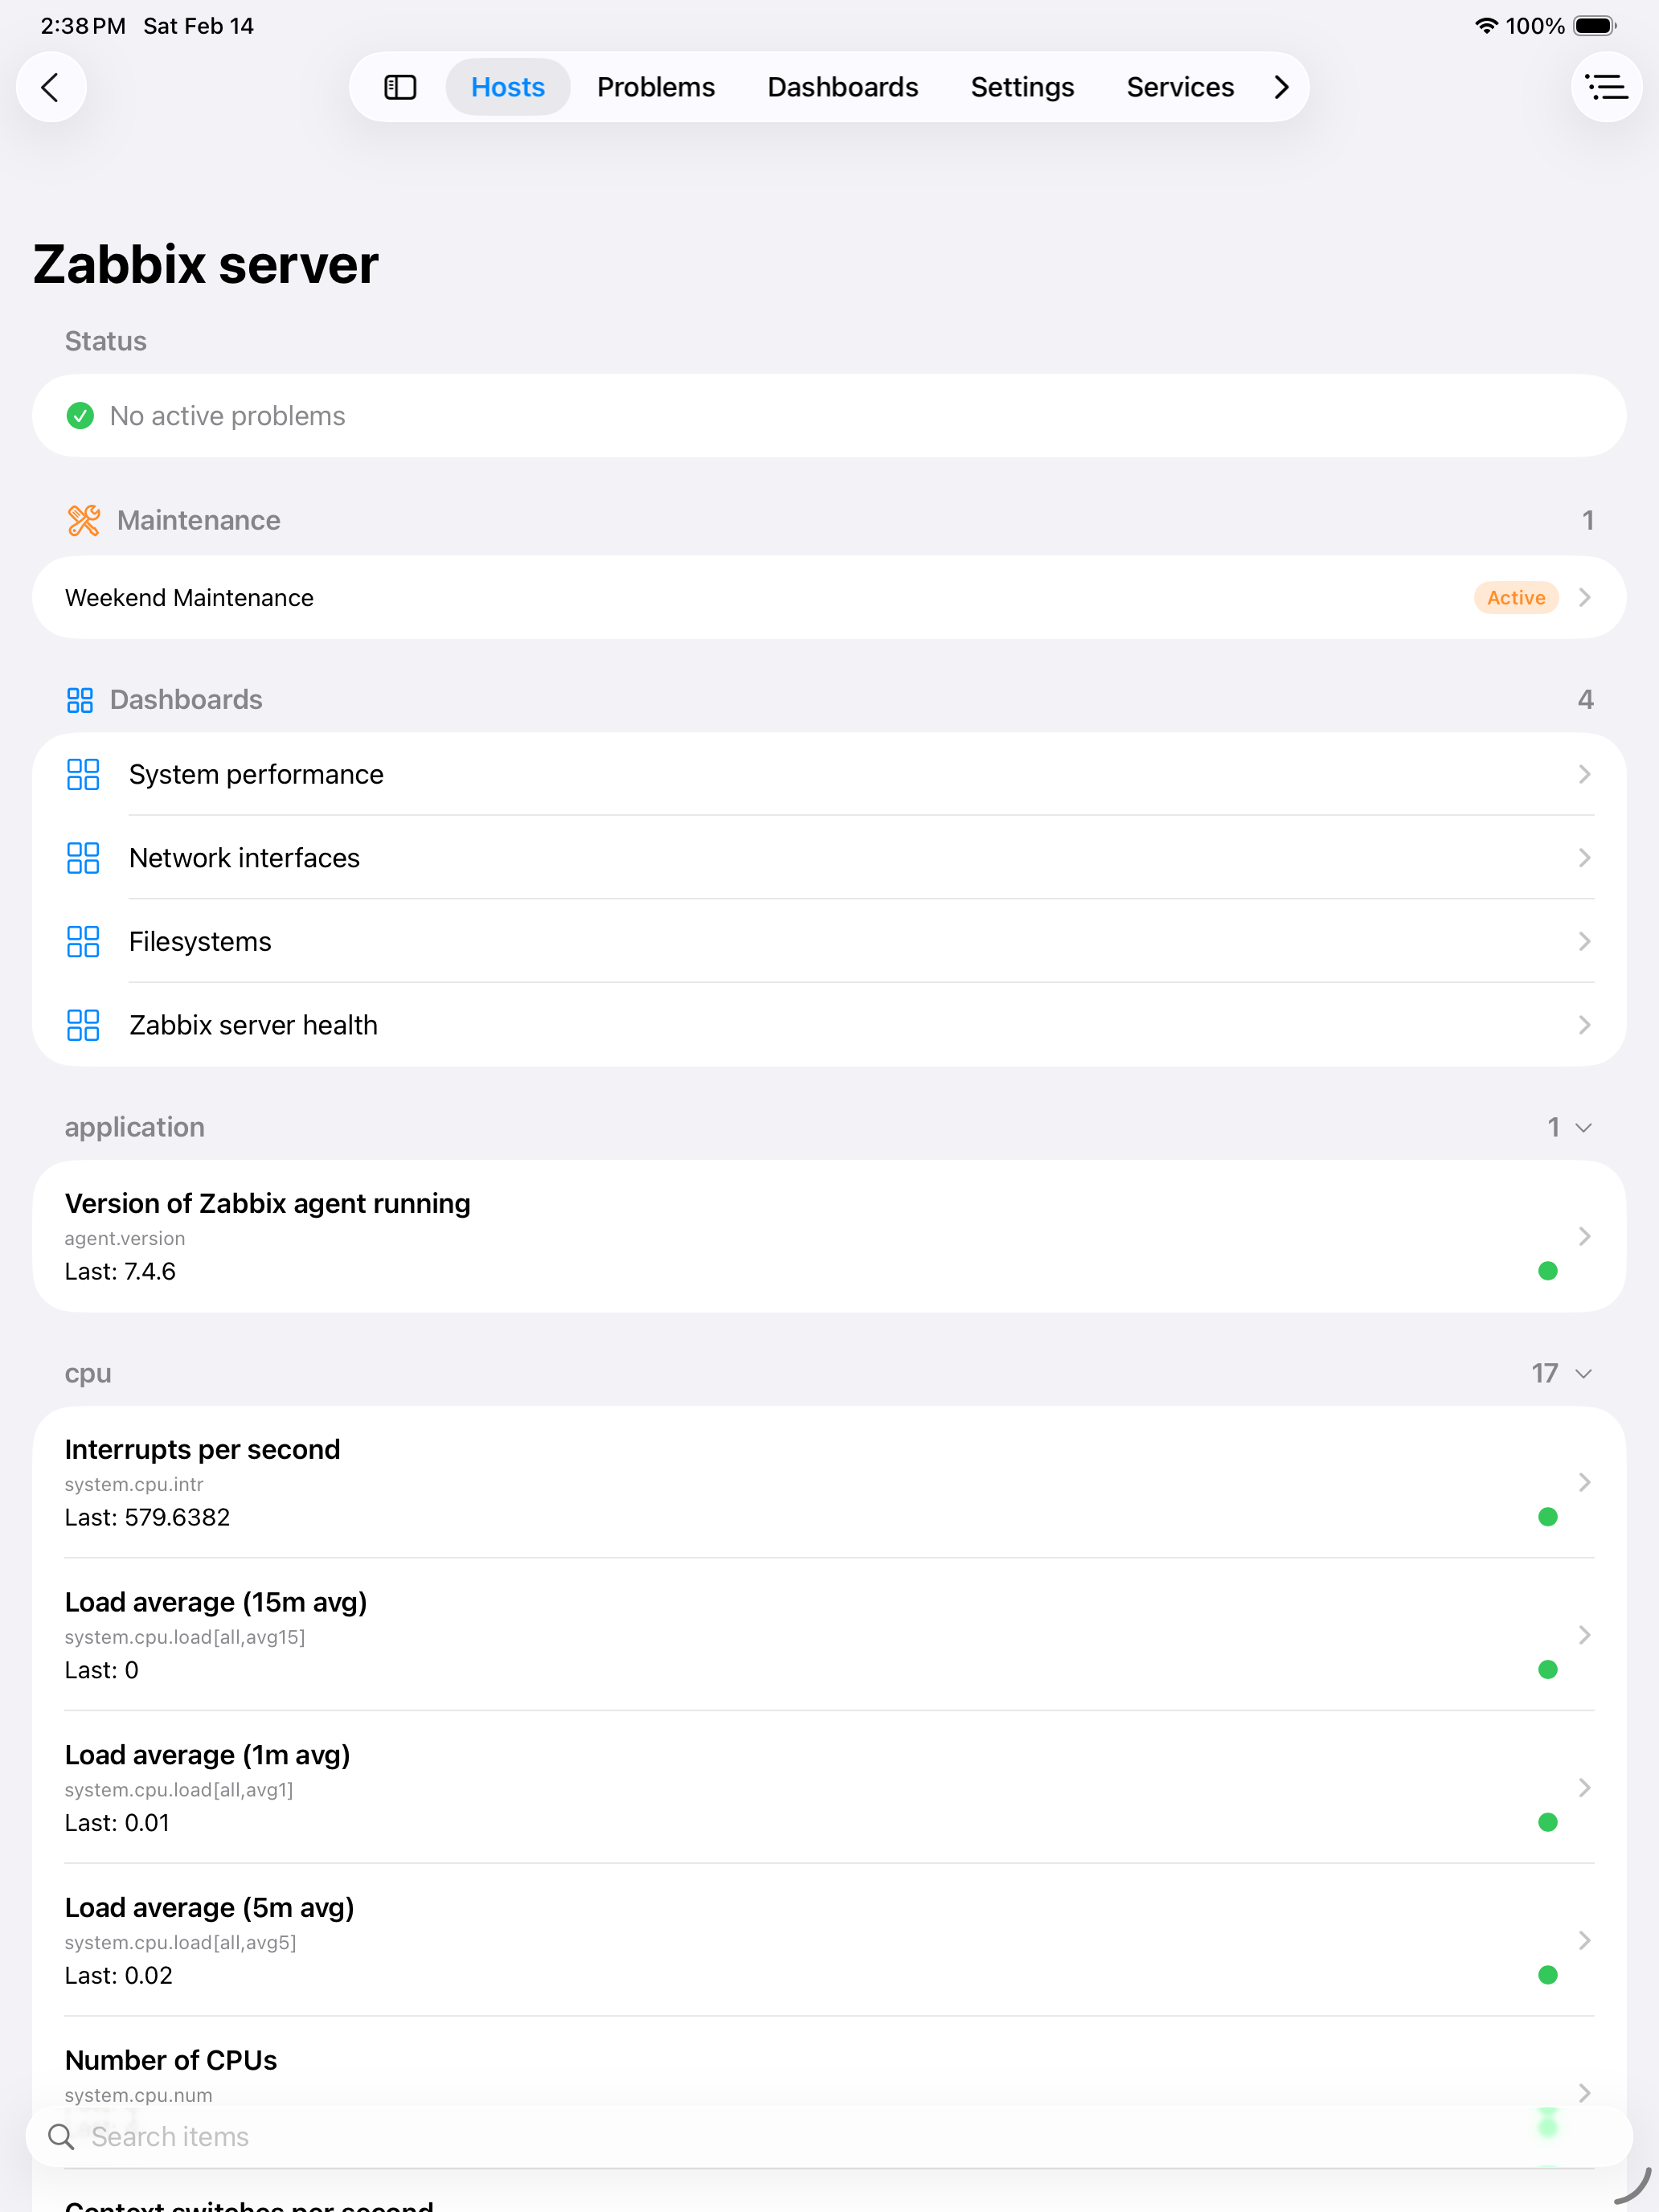
Host Overview
Filter hosts by host group, search with the floating search bar, or show only hosts with issues. Live status indicators and color-coded severity badges show which hosts have active problems.
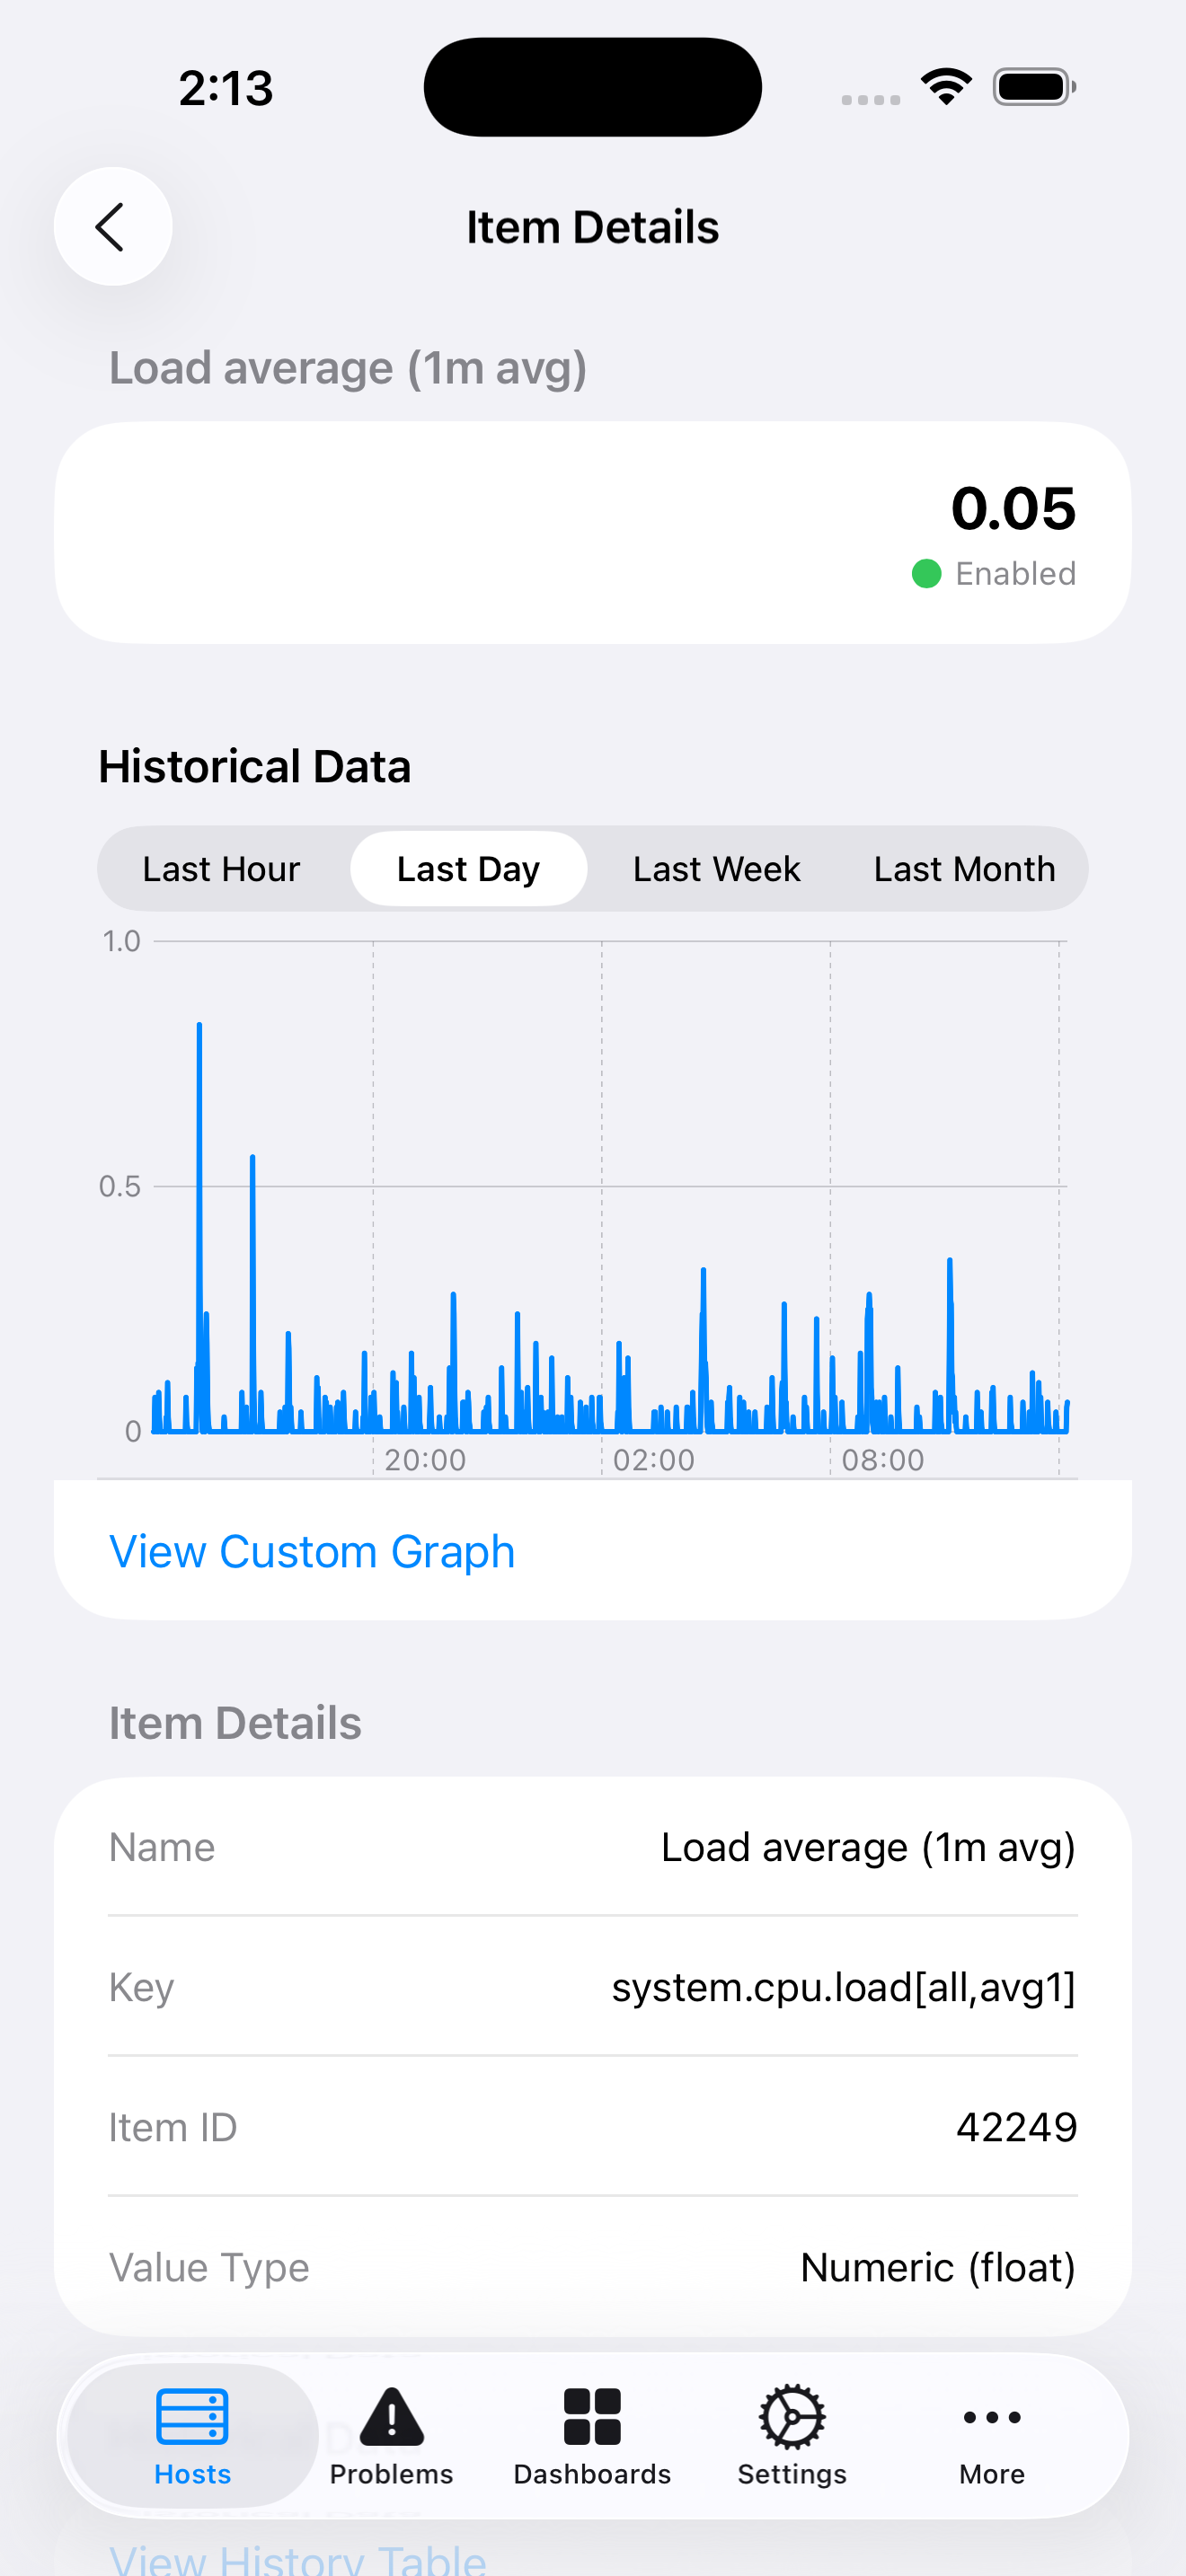
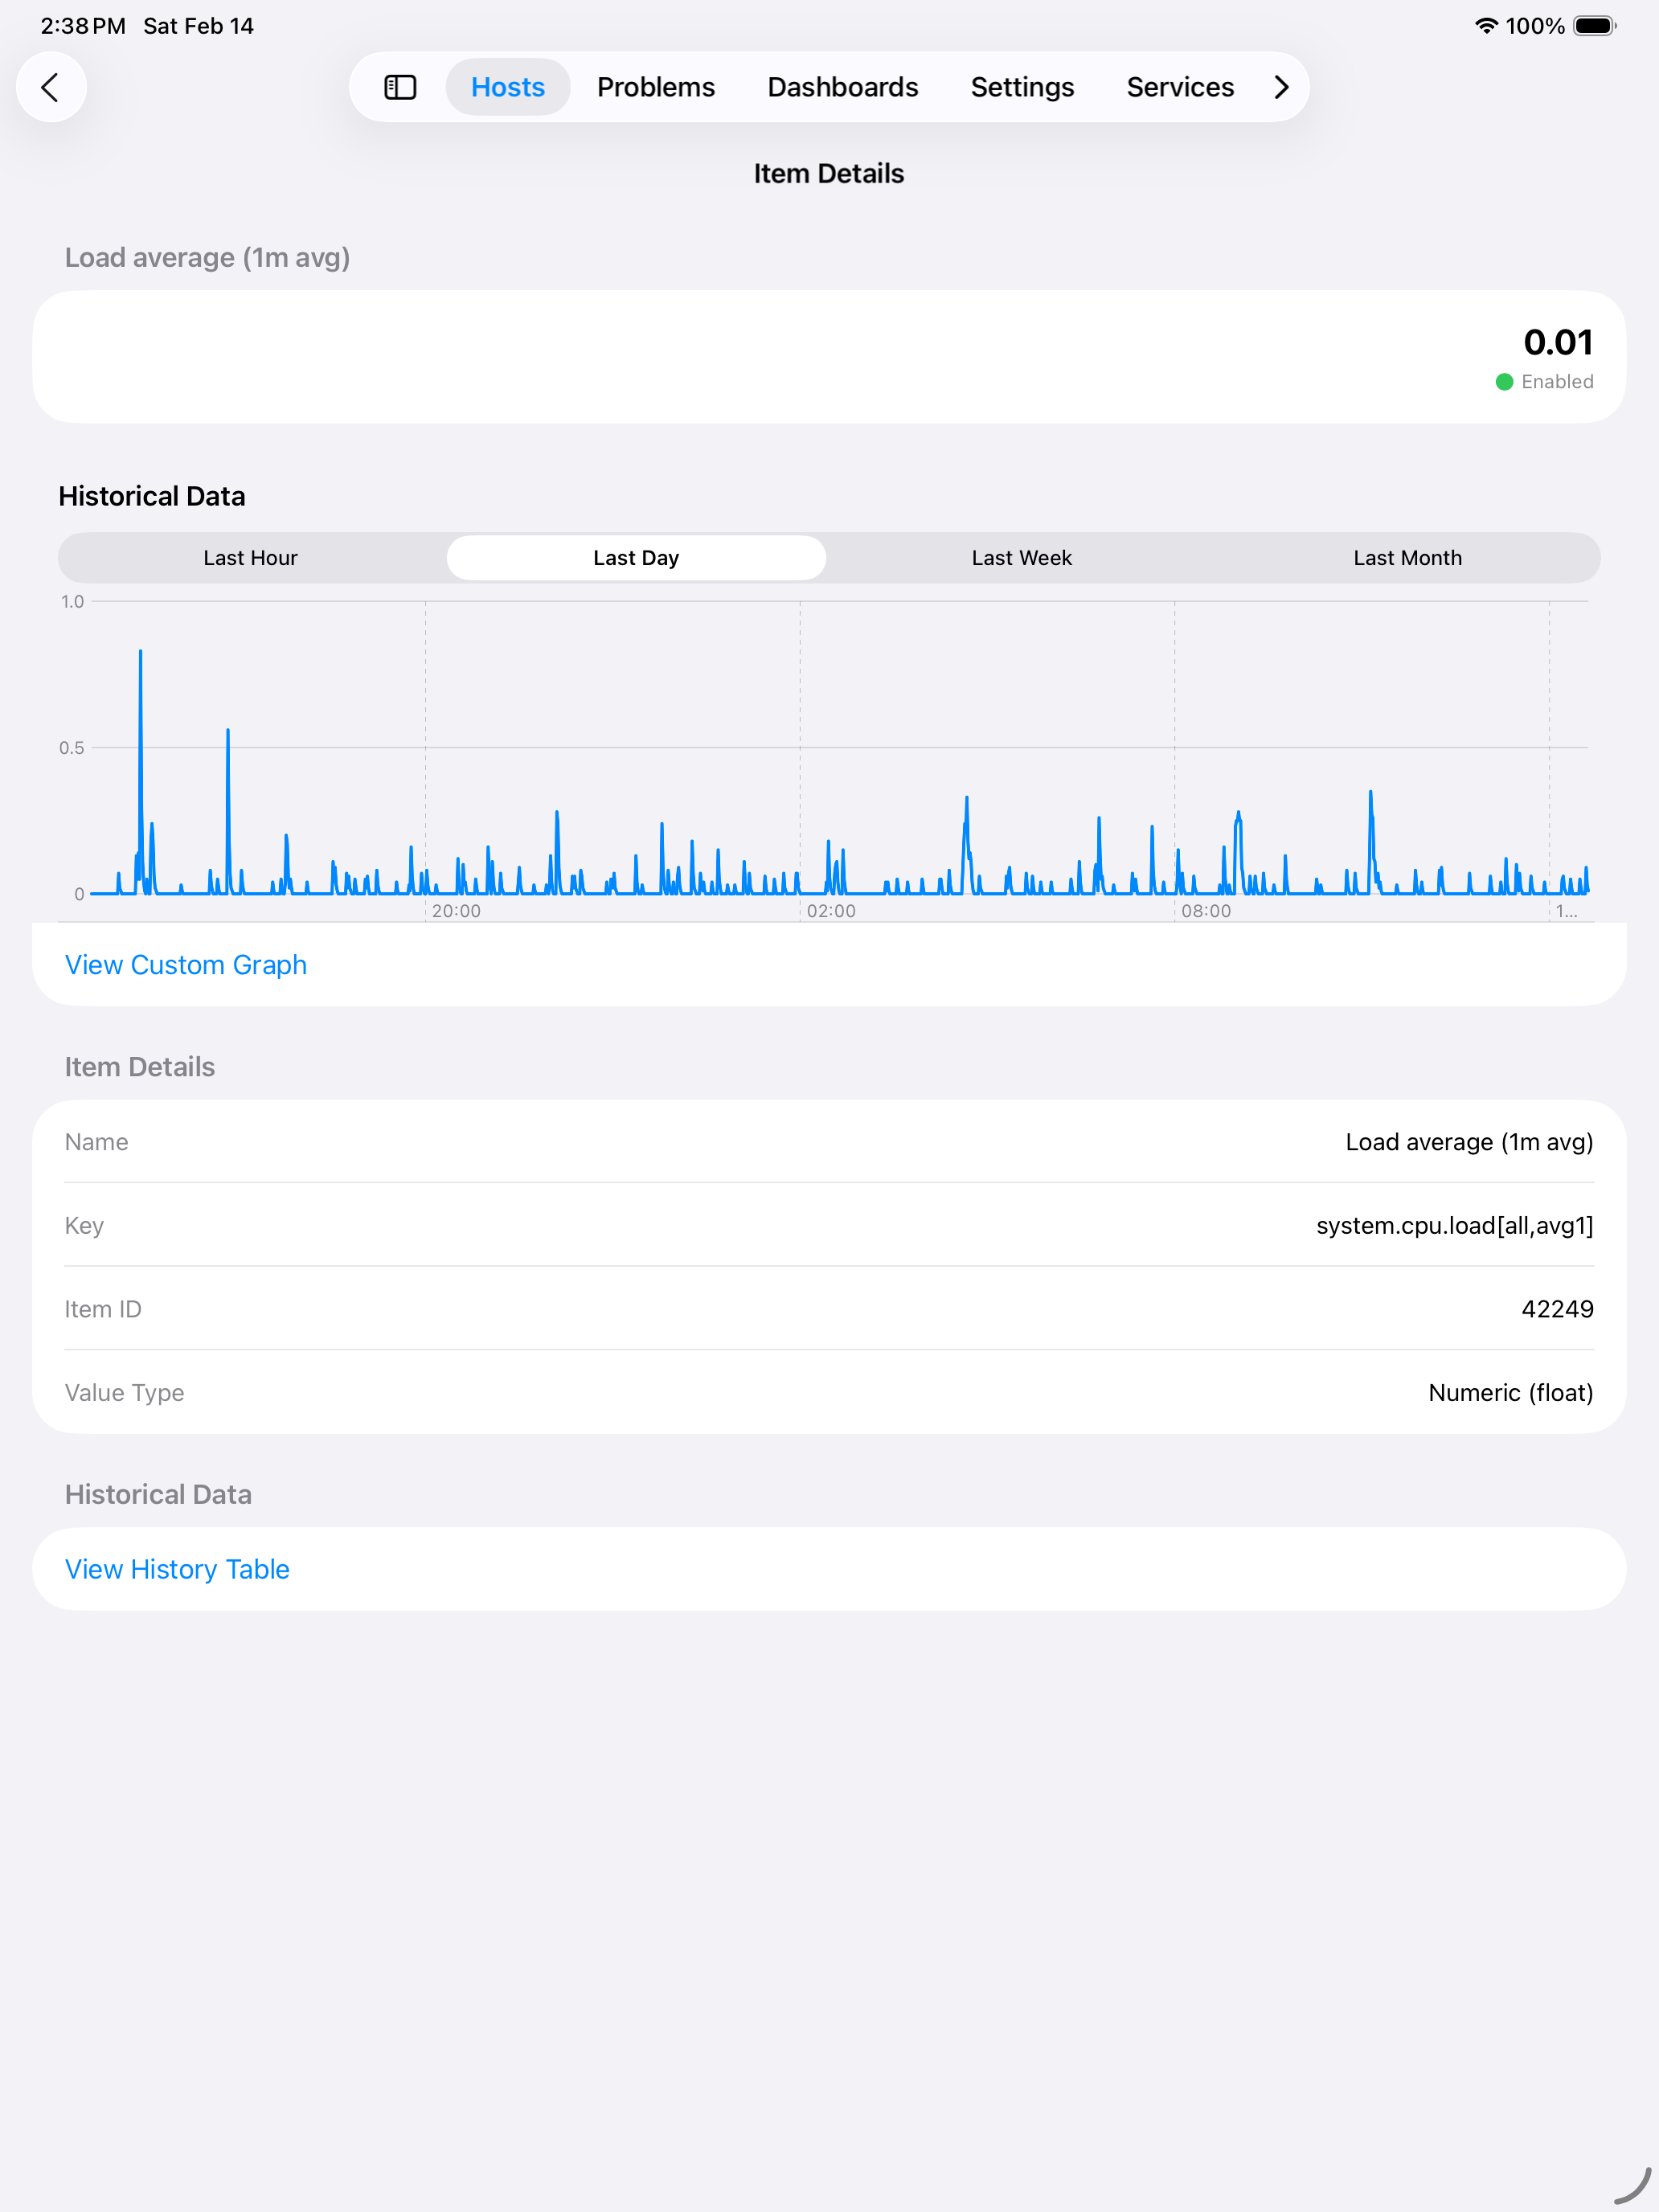
Historical Graphs
Tap into any monitored item to see historical data over the last hour, day, week, or month. Understand trends and spot anomalies from an interactive graph on your phone.
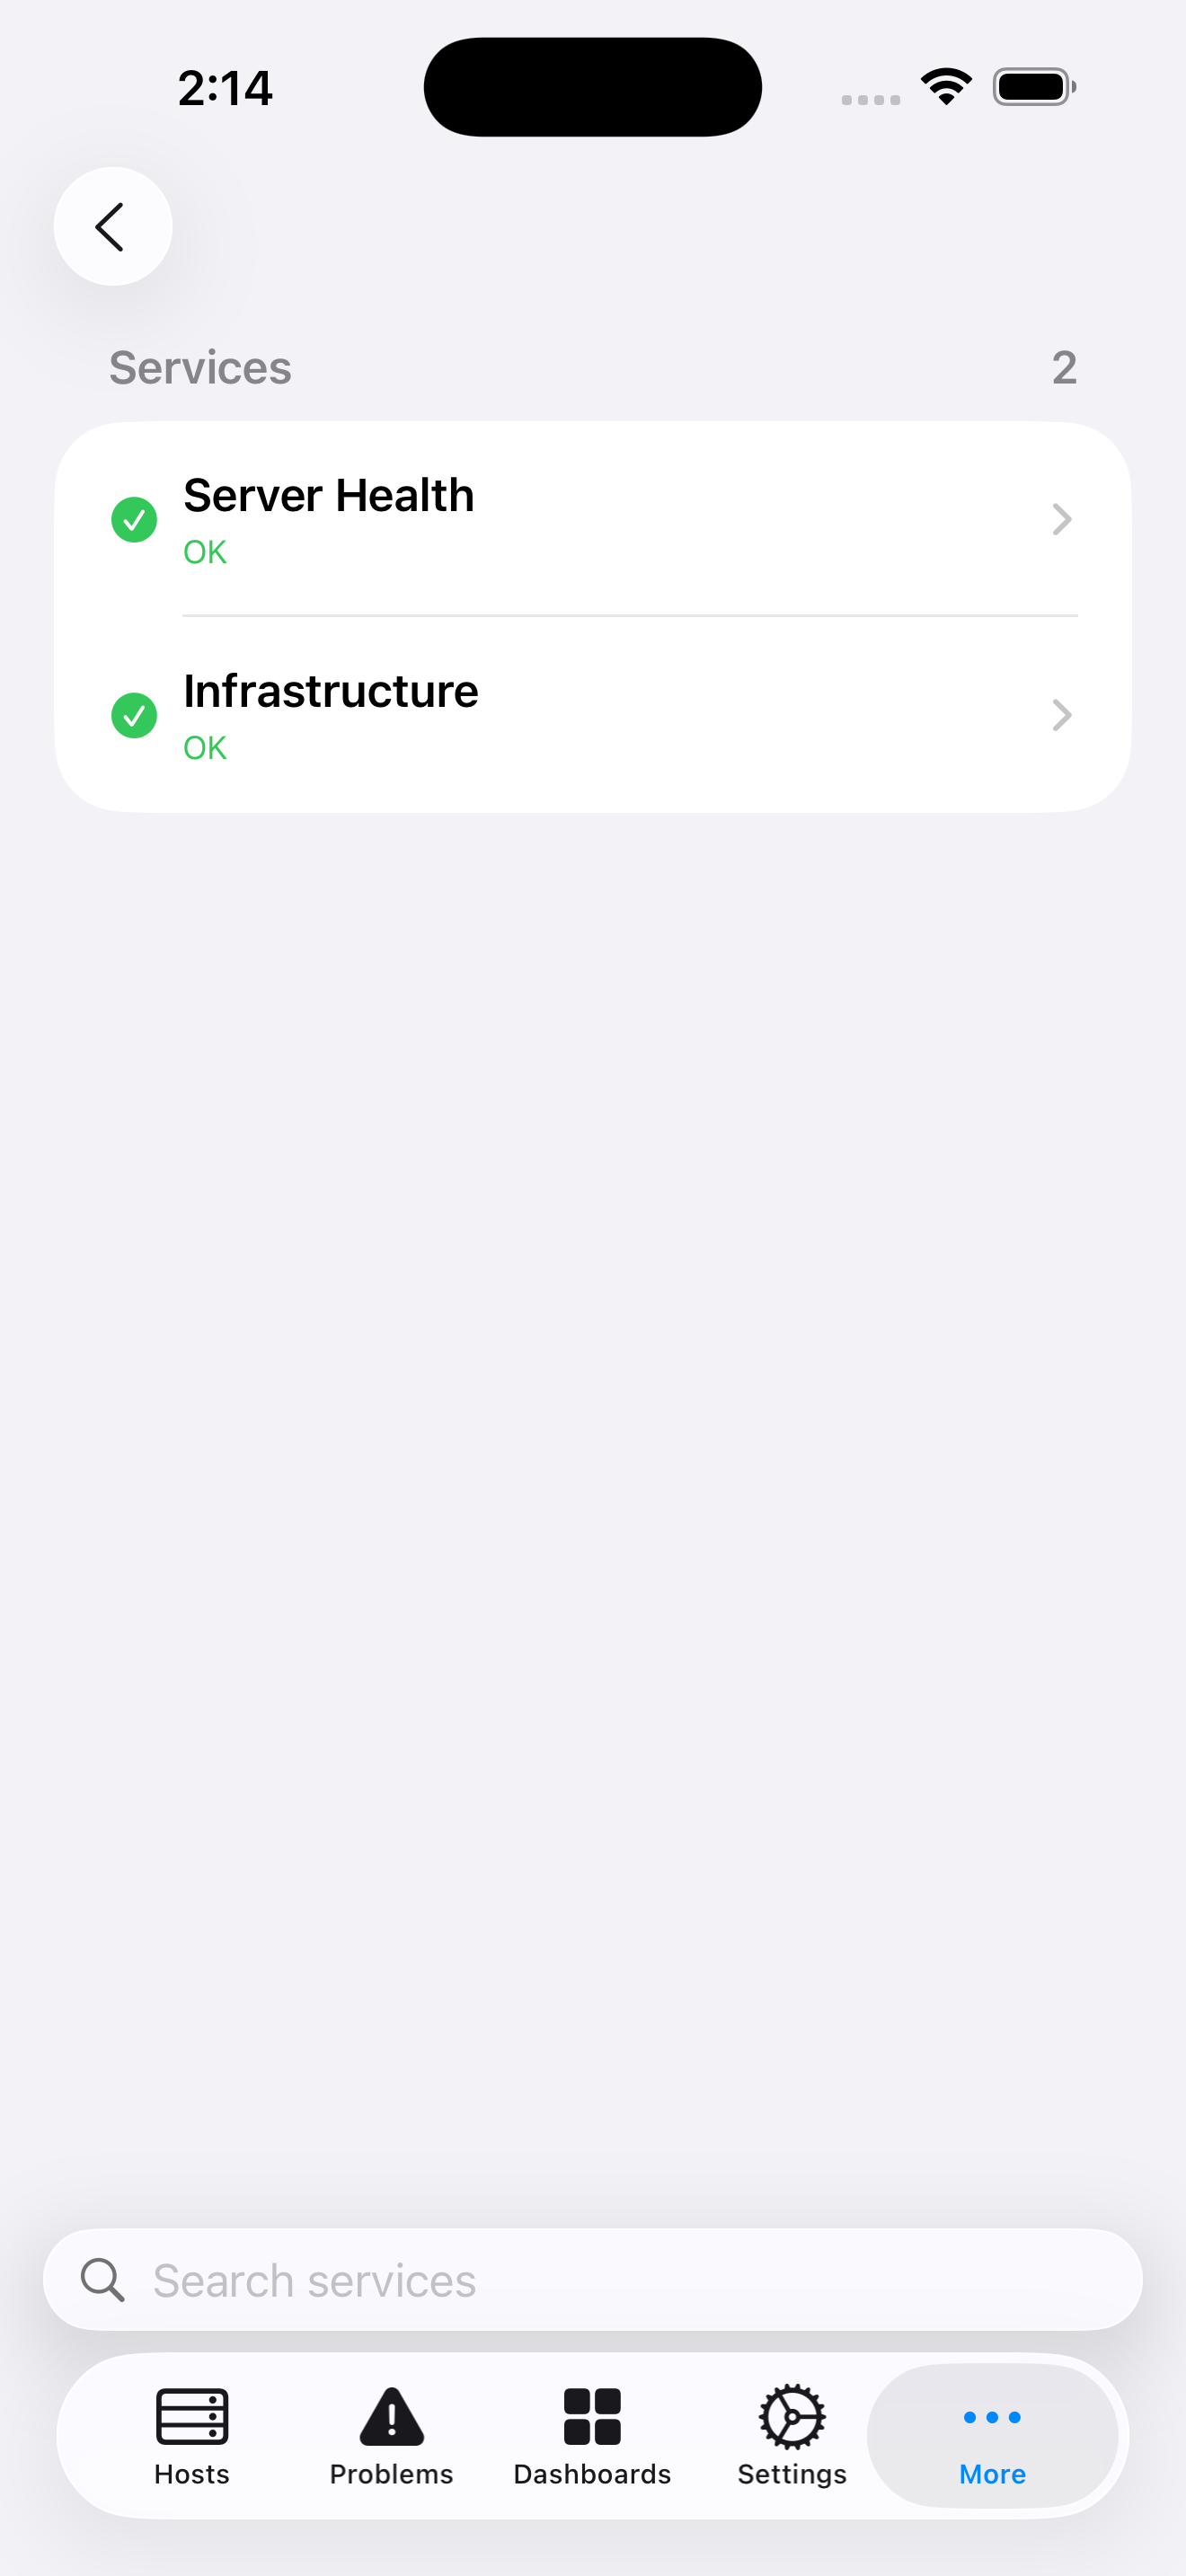
Services and SLA
Monitor your business services and track SLA compliance with SLI metrics. See service health at a glance and drill in to view status, child services, and SLA data.
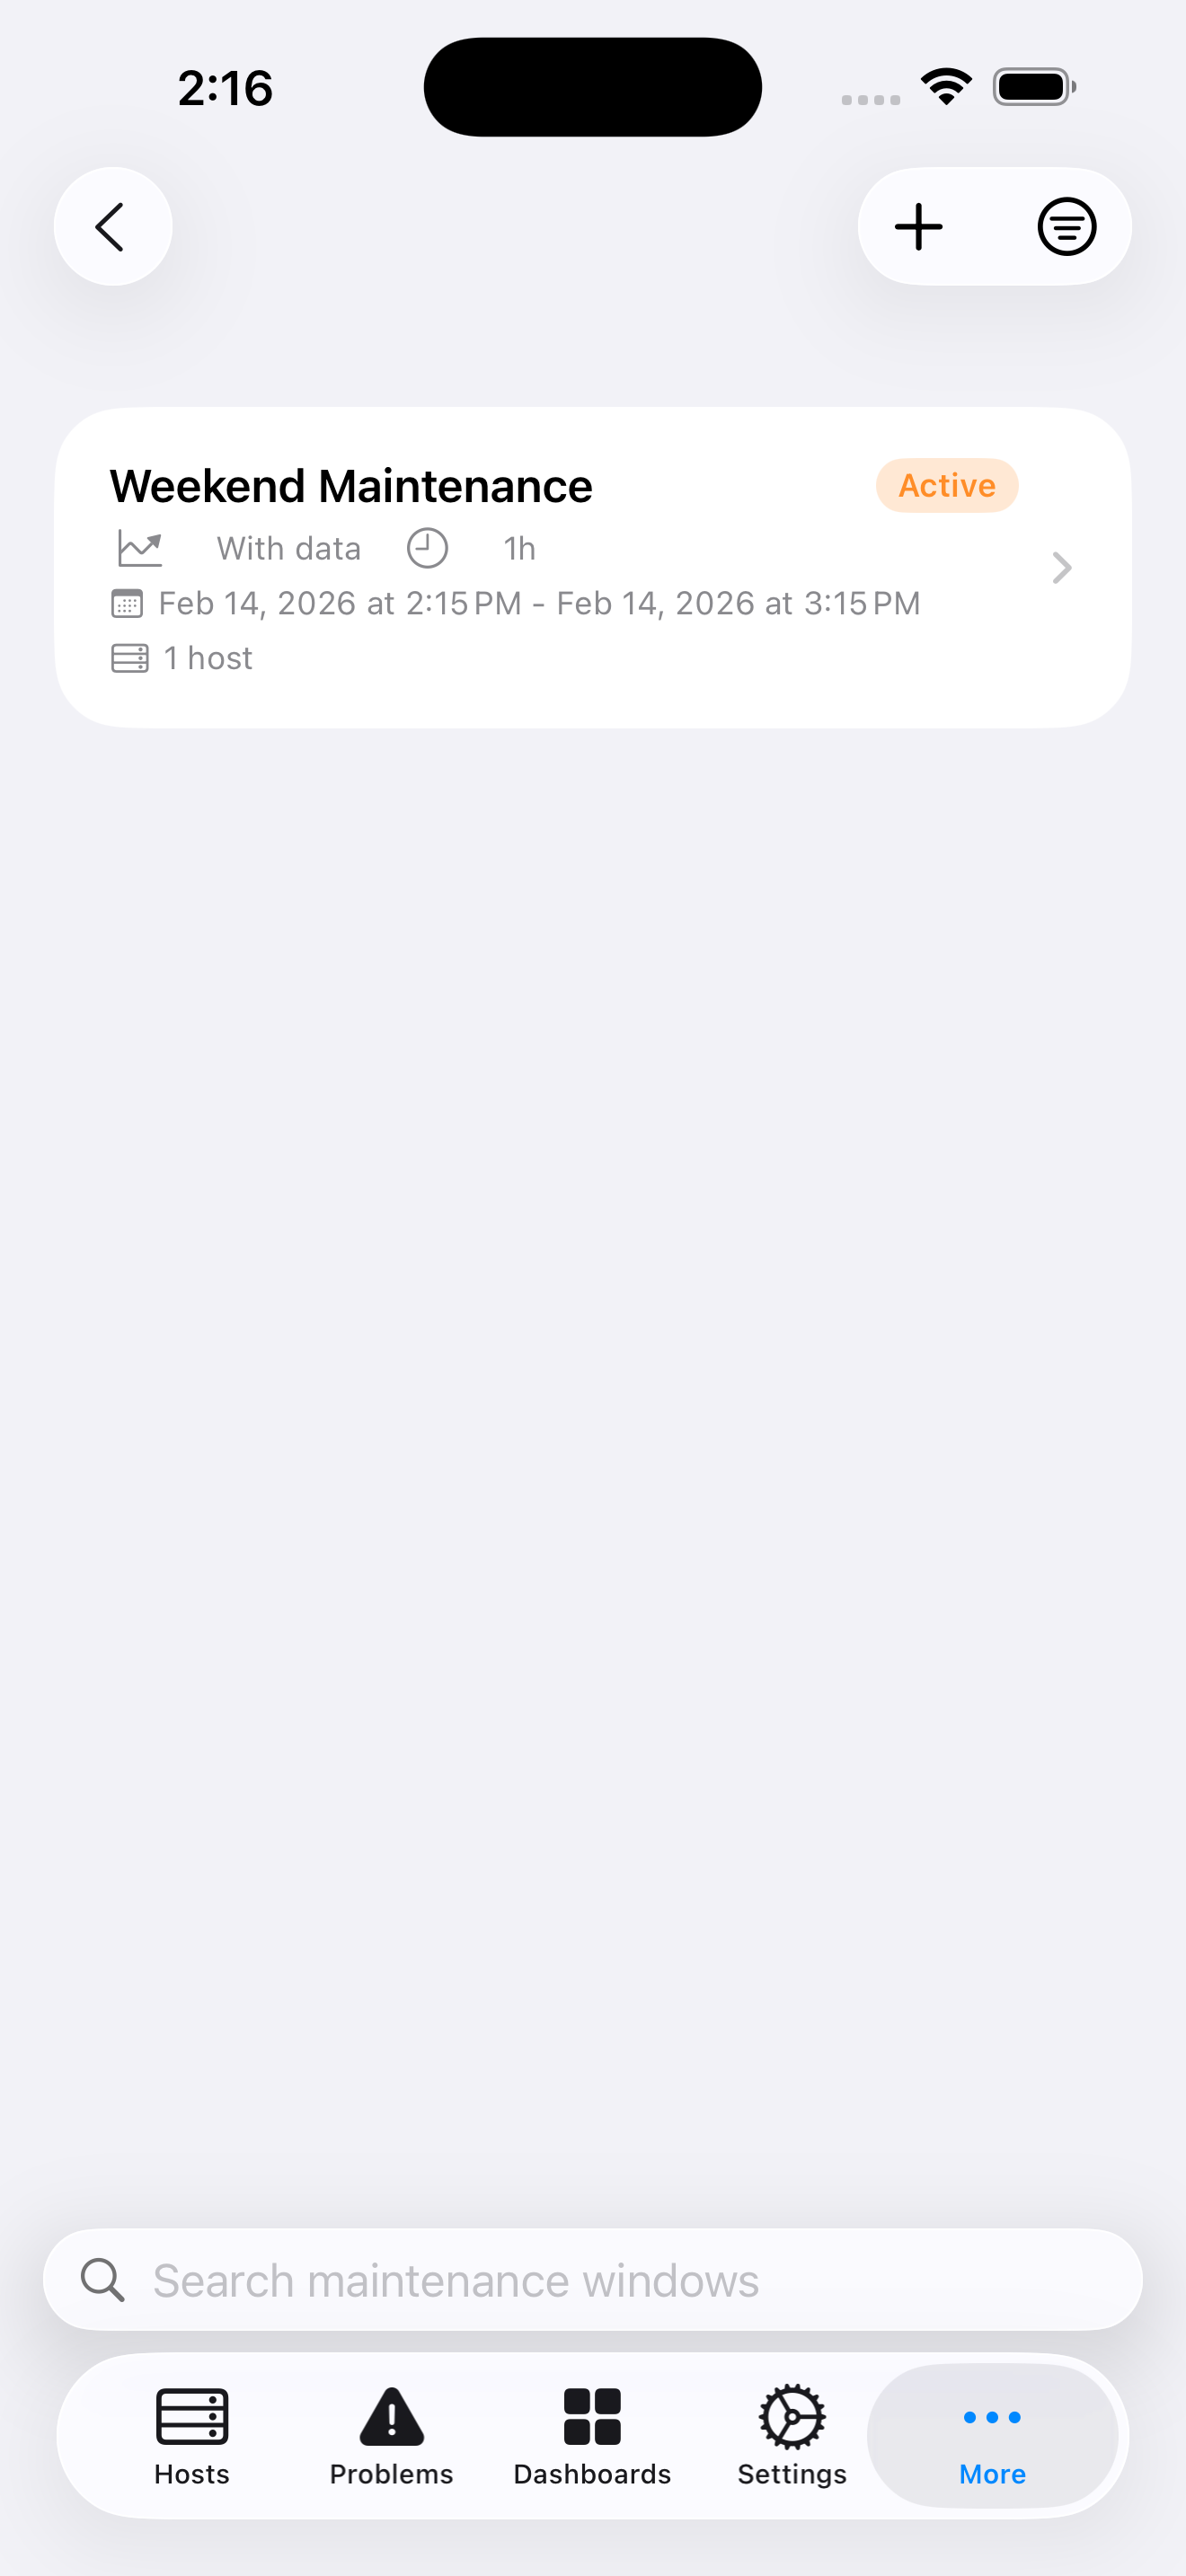
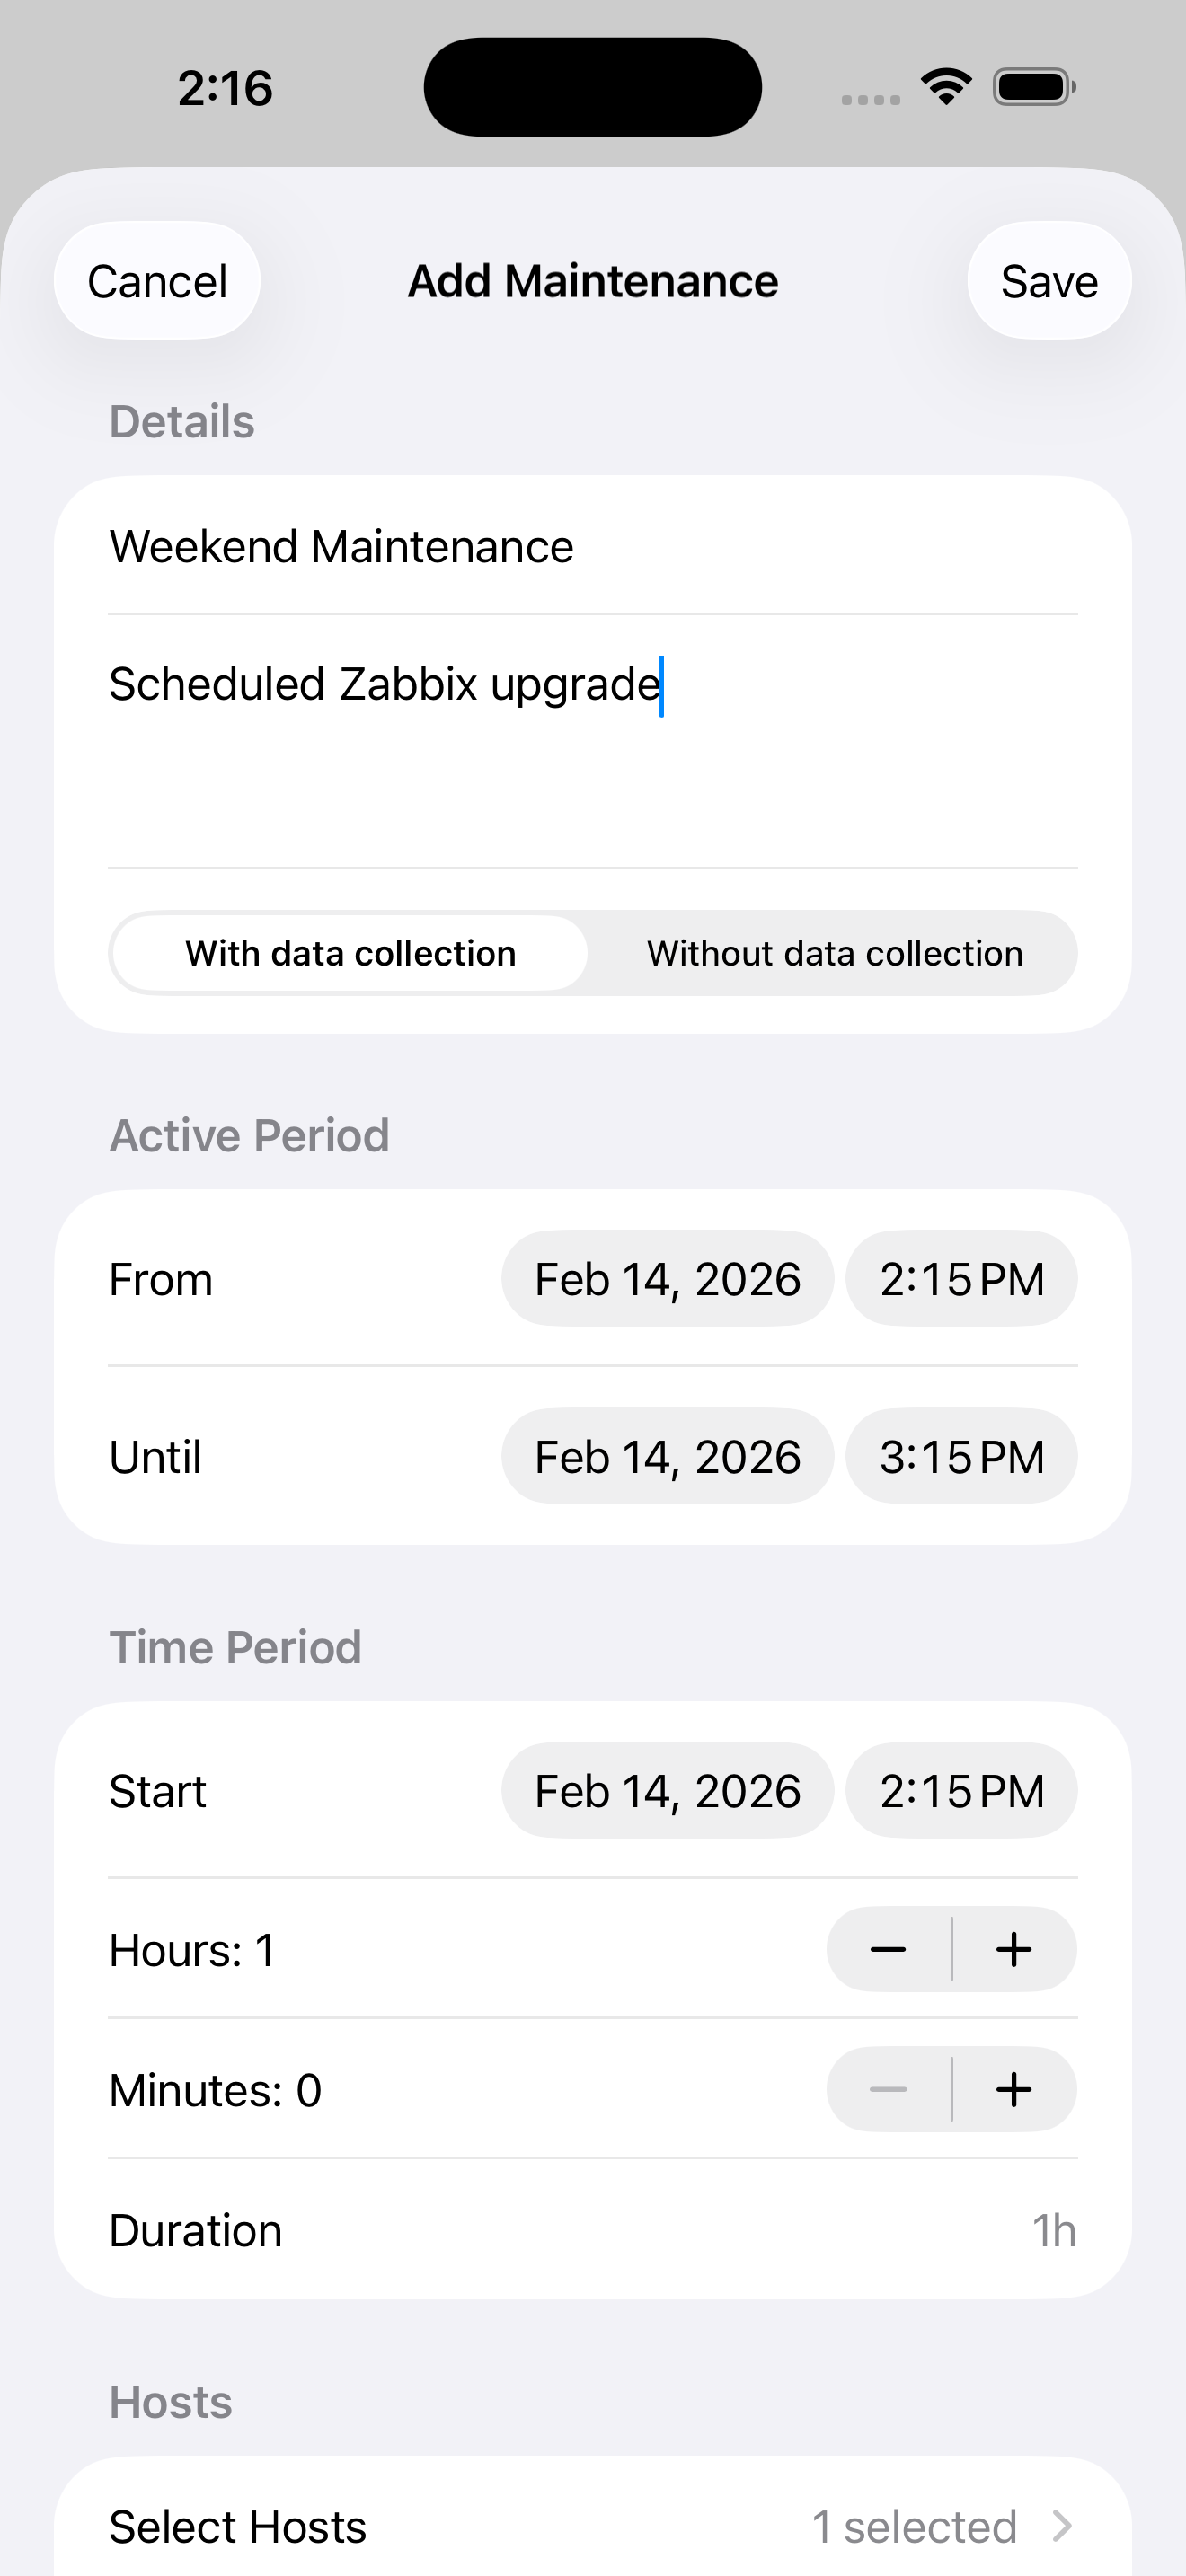
Maintenance Windows
View, create, and manage maintenance windows directly from your device. Schedule one-time or recurring maintenance, select target hosts and groups, and keep your team informed—without needing to open a browser.
Web Scenarios
Monitor your HTTP tests, response times, and web endpoint availability. See which web scenarios are passing or failing, review step-by-step results, and catch website issues before your users do.
Alerts and Notifications
Review your alert and notification history, including escalations and acknowledgments. See which alerts were sent, to whom, and when.
Search and Filter Everything
A floating search bar follows you throughout the app. Find any host, problem, service, or dashboard with full-text search. Filter problems by severity or acknowledgment state. When your infrastructure is large, Grafo helps you cut through the noise.
Built for Privacy
Grafo connects directly to your Zabbix server—no middleman, no cloud relay, no data collection. Your infrastructure data stays between your phone and your server. No tracking, no analytics, no ads.